RSI or you can call it the Relative strength index is one of the most widely used technical analysis indicators you will find on the Pocket Option trading platform. In this article, we will explore the RSI indicator on the Pocket Option and how you can use it properly to gain the best trading results.
What is the RSI indicator?
RSI ( Relative Strength Index), is a trend indicator or a Momentum oscillator that measures the speed and the change of price movement. This indicator oscillates from a scale of 0 to 100 and you can typically use overbought and oversold levels to identify the upcoming trends and reversals. An asset is considered to be at an overbought level when the moving average line in the RSI indicator exceeds line 70 and similarly, when the moving average line in the RSI indicator drops below 30 it signals an oversold level.
Implementing RSI indicator on Pocket Option
RSI indicator is a free-to-use tool and you can even use this indicator on the Pocket Option demo account. Below is the step-by-step guide and how to implement the RSI indicator on the Pocket Option.
Step 1> Login to your Pocket Option account: The first and foremost step is to log in to your Pocket Option account. In you don’t have one, click here or fill in the form above.
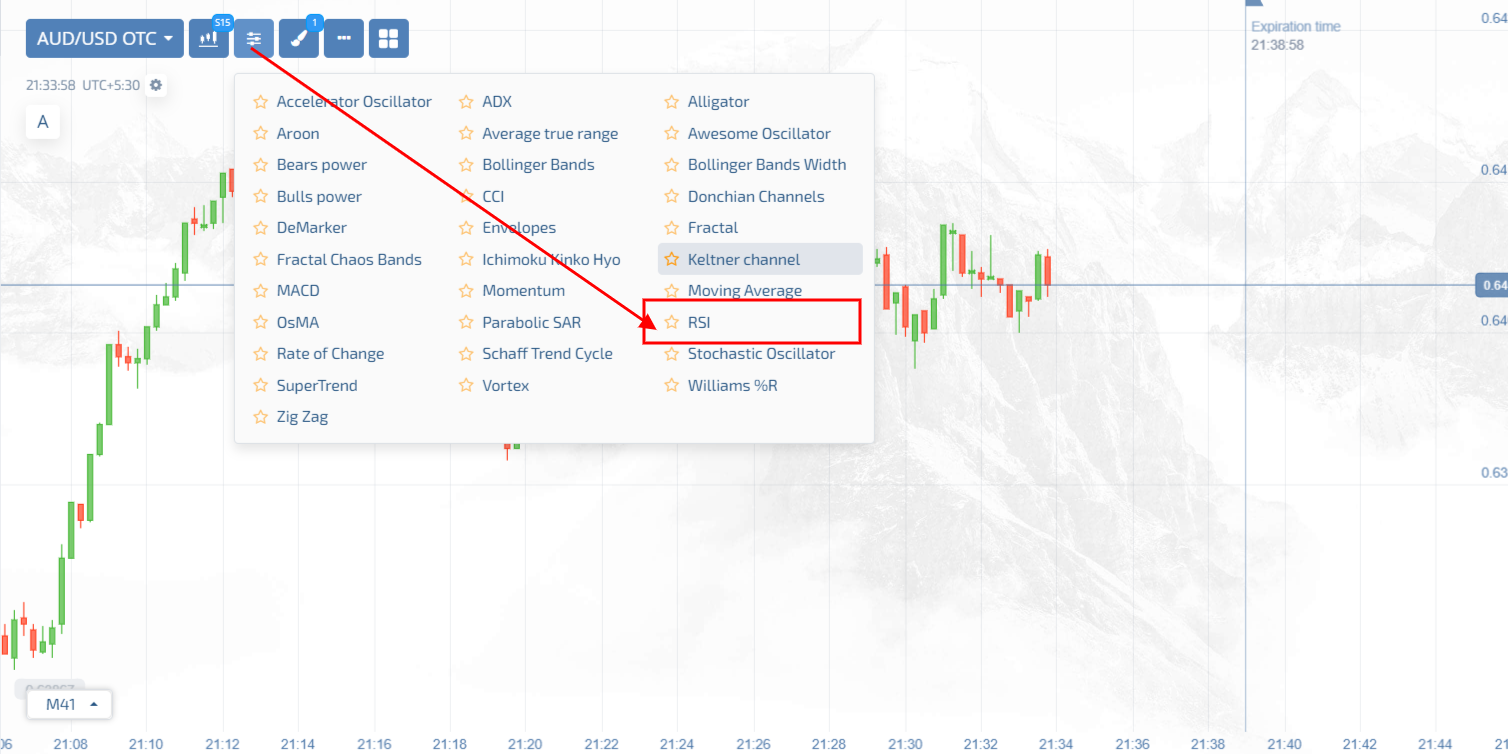
Step 2> Access the trading dashboard: Once you have signed up you will get access to the Pocket Option trading dashboard. Now, click on the indicator button at the top of the page.

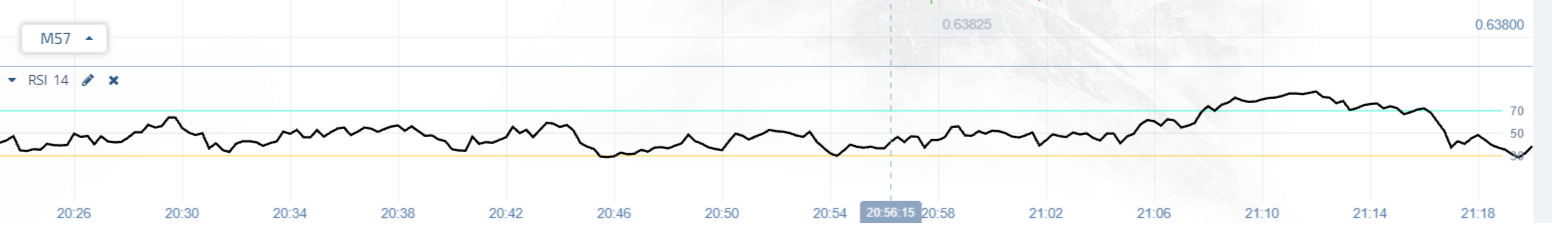
Step 3> Adjust the indicator settings: Once you have found the indicator name from the trading dashboard now you can adjust the indicator settings you can even change the moving average line colour or adjust the period of the indicator.
Importance of moving average line
As I said above, the RSI indicator is made from the composition of a moving average line. Traders mainly use the moving average line in the indicator to predict upcoming trends and reversals. when the moving average line in the RSI indicator is above 70 it signals an overbought level or upcoming bearish trend similarly, when the moving average line in the RSI indicator is below 30 it signals an oversold level or an upcoming bullish trend.
Trading strategies with RSI indicator
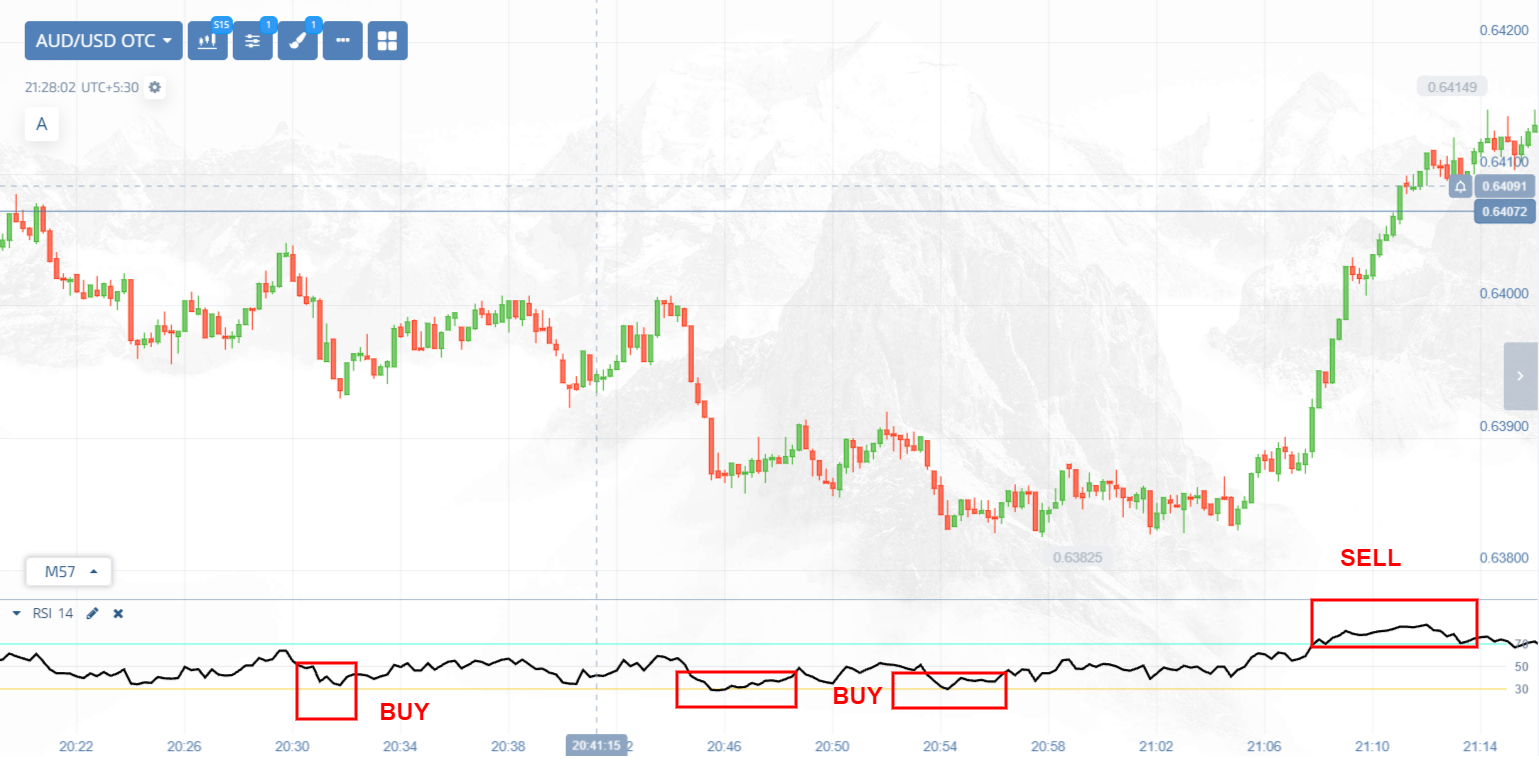
Overbought and Oversold levels: One of the most straightforward strategies you can use via the RSI indicator is overbought and oversold levels. When the RSI indicator line is above 70 it signals an upcoming bearish trend and vice versa when the RSI indicator line is below 30 it signals an upcoming bullish trend.
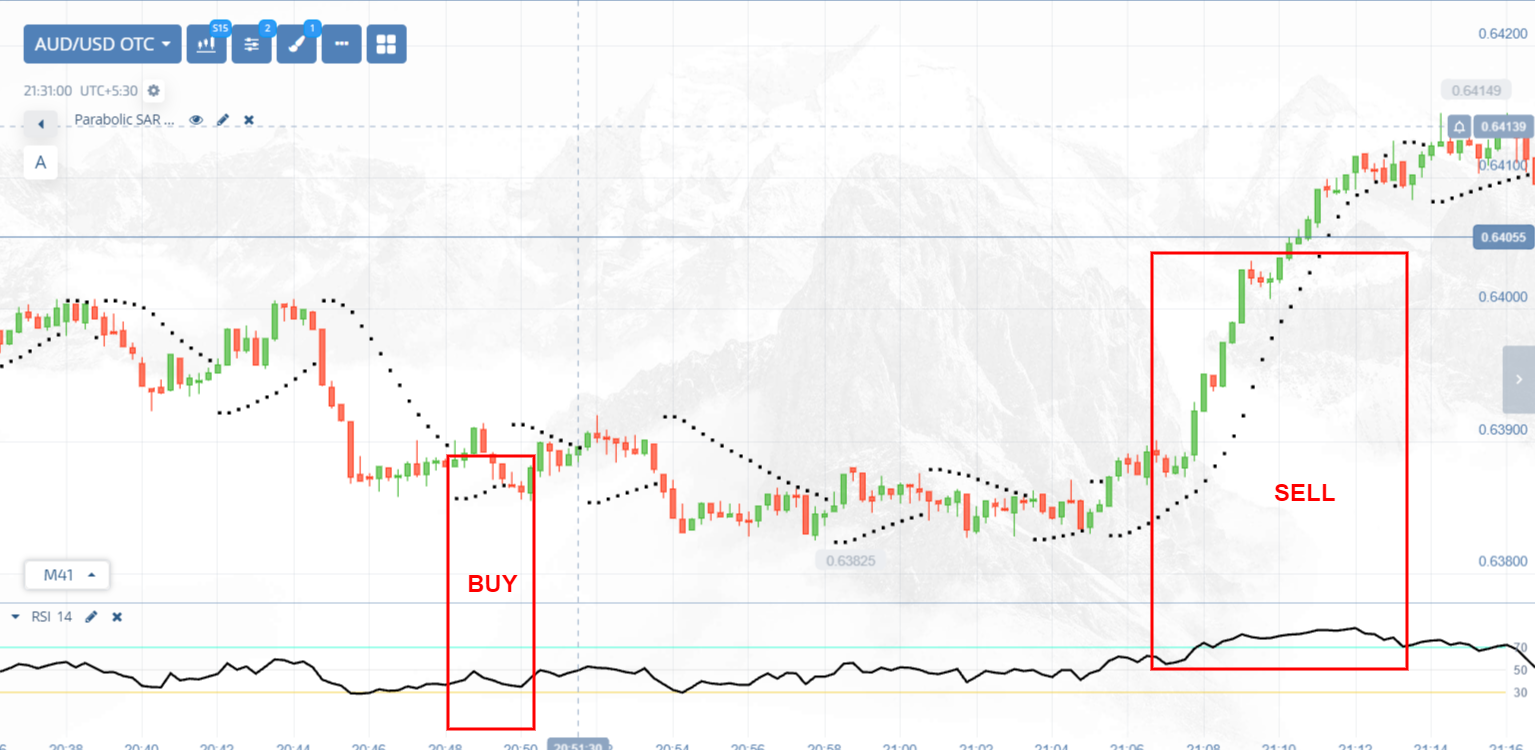
Combining the RSI indicator with other indicators: The RSI indicator alone is a potent trading tool. However, combining it with other trend indicators like Parabolic SAR can increase your profit twice. For instance, if you get a buy signal using the RSI indicator plus you see Parabolic SAR dots below the price it signals an upcoming bullish trend and vice versa if you get a sell signal using the RSI indicator plus the Parabolic SAR dots is above the price it signals an upcoming bearish trend and you can use this opportunity to place sell trade.
