Signing up is free and takes 5 secs only…
A Stochastic Indicator or you can call it a Stochastic Oscillator is a momentum indicator used by traders to identify an upcoming trends and reversals using an overbought zone and an oversold zone. You can easily find and use this indicator at Olymp Trade indicator section.
What is a Stochastic Indicator?
A Stochastic Indicator is a popular trend indicator used in technical analysis. This indicator was developed by George Lane. It oscillates around the 0 to 100 zone. where the line 50 -100 is considered a bullish zone similarly, line 0 -50 is considered a bearish zone.
This Indicator uses the two most important moving average lines % K and % D. The intersection points between these two lines generate buy and sell opportunities.
How to Setup Stochastic Indicator on Olymp Trade?
Login to your Olymp Trade account first. Click the indicator menu and select Stochastic from the same.

You can also change colour and darken the line for better visibility. To edit the indicator click on the pencil icon.

How to use Stochastic Indicator at Olymp Trade

You don’t need to be an experienced trader to understand the concept of Stochastic Indicator at Olymp Trade. The concept is very easy. You just need to focus on overbought and oversold levels.
In case, you don’t know. when the Stochastic Indicator line % K and % D intersect above or near line 80 it means that the market is currently at an overbought level and here you can consider placing a buy trend. Similarly, when the %K and %D line intersects below or near line 20 it means that the market is at an oversold level and here you can consider placing a sell trade.
Best Stochastic Settings for 1 minute chart
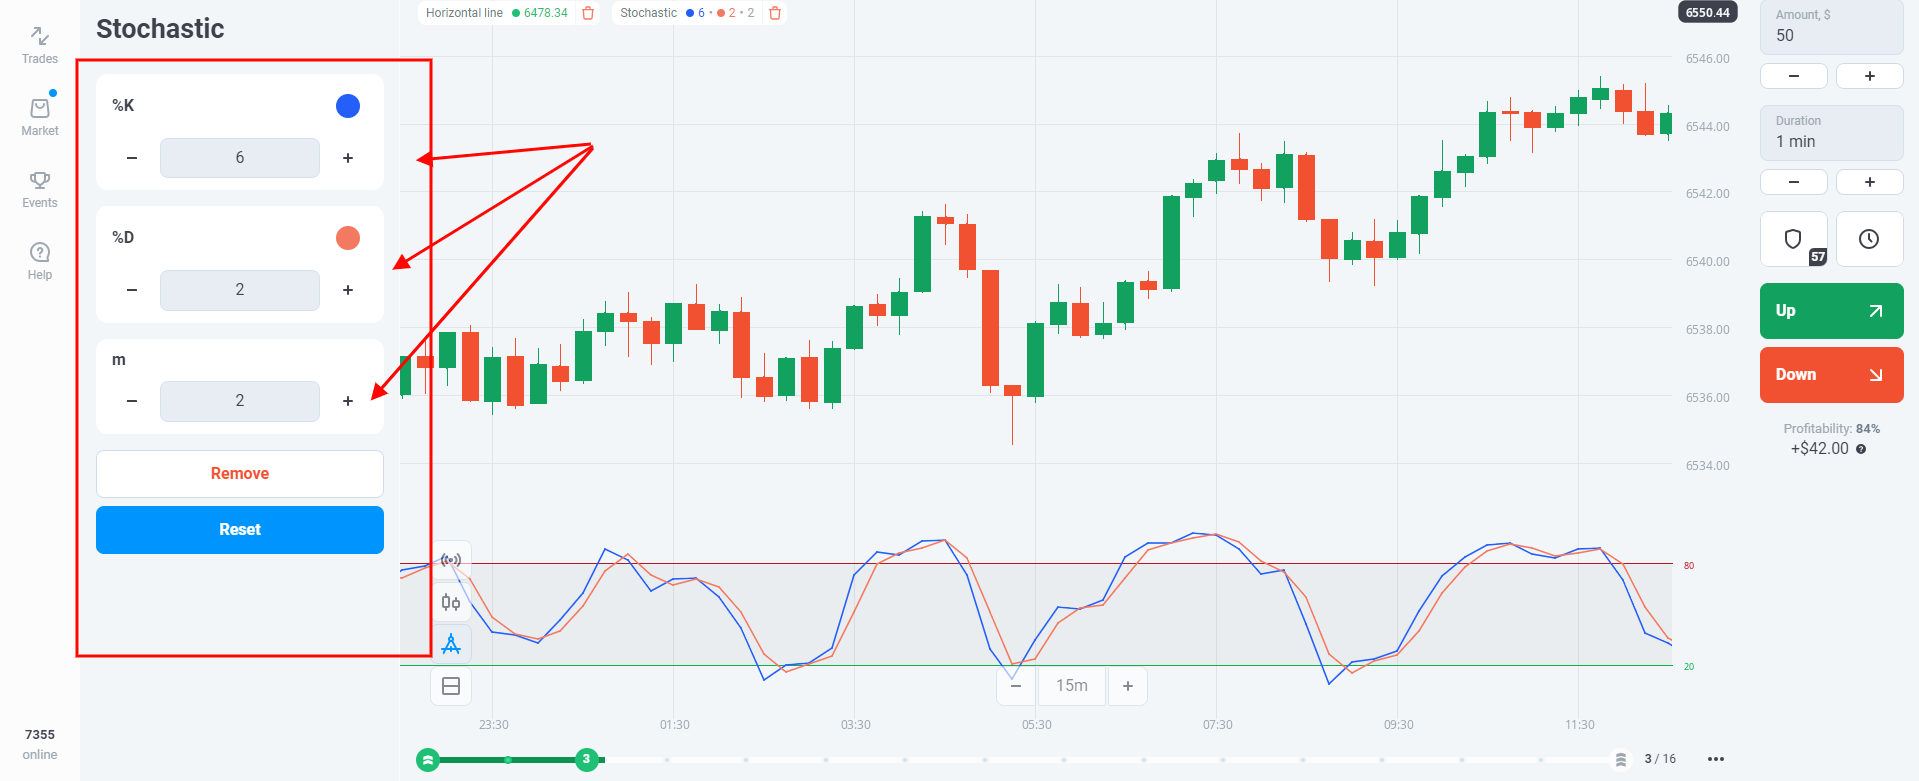
Many Intraday Traders like me love to place 1- minute trades in Olymp Trade. However, It is not recommended to place 1-minute trades using the default setting of Stochastic Indicator. The default of the indicator is 14 which is made for swing traders. Therefore, click on the pencil icon and reduce the Stochastic Settings to %k = 6, %D = 2 and M=2. This will increase the sensitivity of the Stochastic indicator and It will react much more faster to price changes.
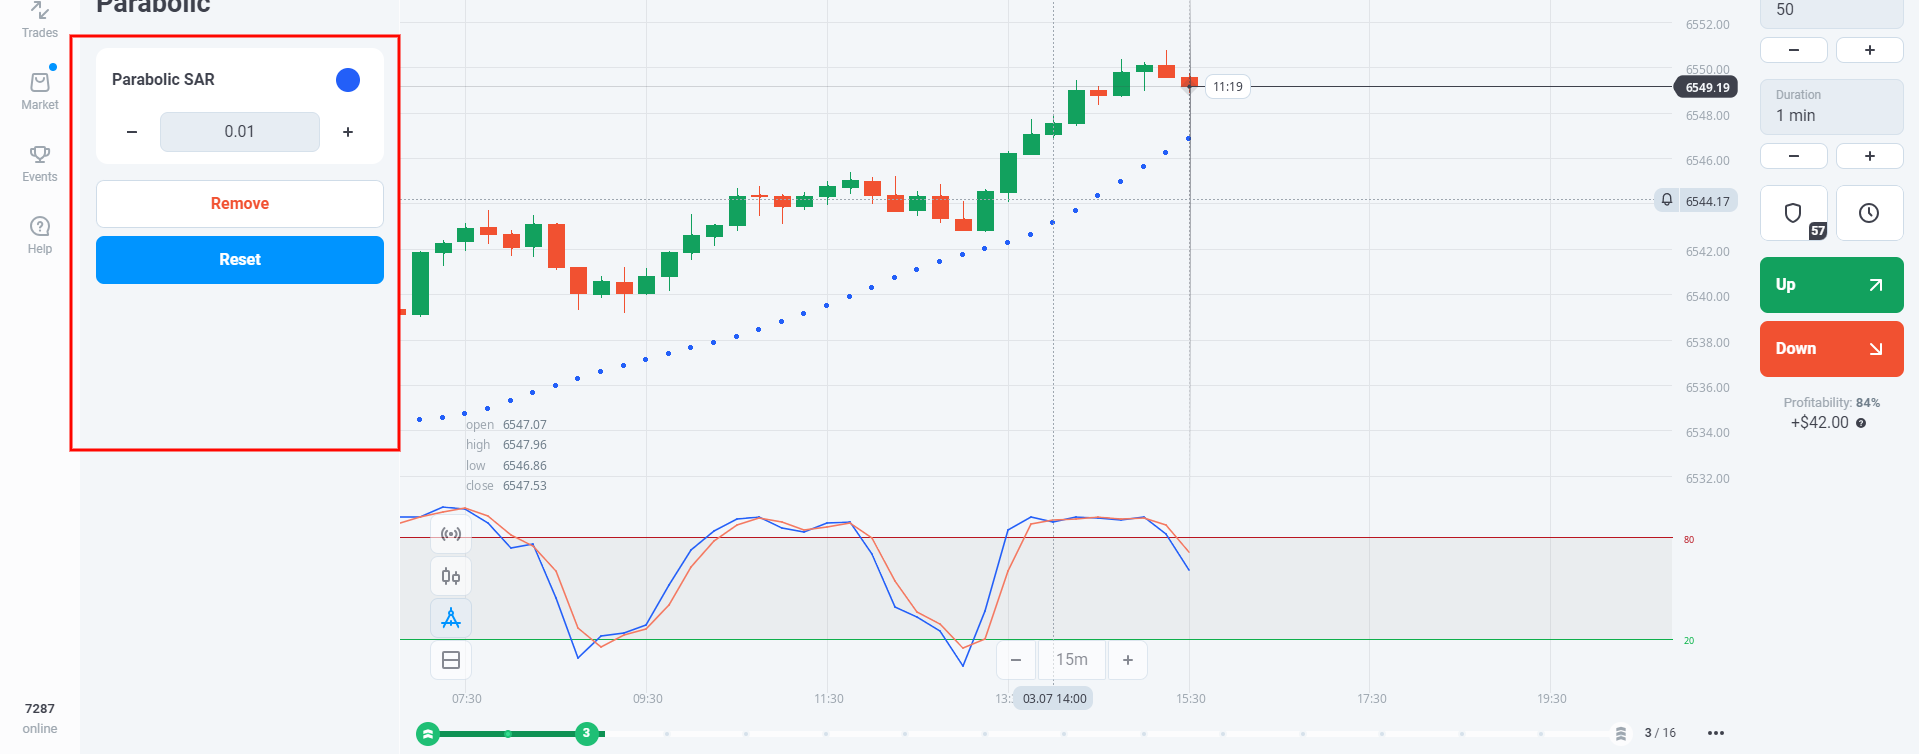
You can easily place 1-minute trades with a Stochastic Indicator however, If you want better results you should combine it with other trend indicators like MACD Indicator or Parabolic SAR. For Instance, let’s combine it with Parabolic SAR. Similarly, click on the indicator button and select Parabolic SAR from the menu next reduce the Parabolic SAR indicator duration to 0.01.
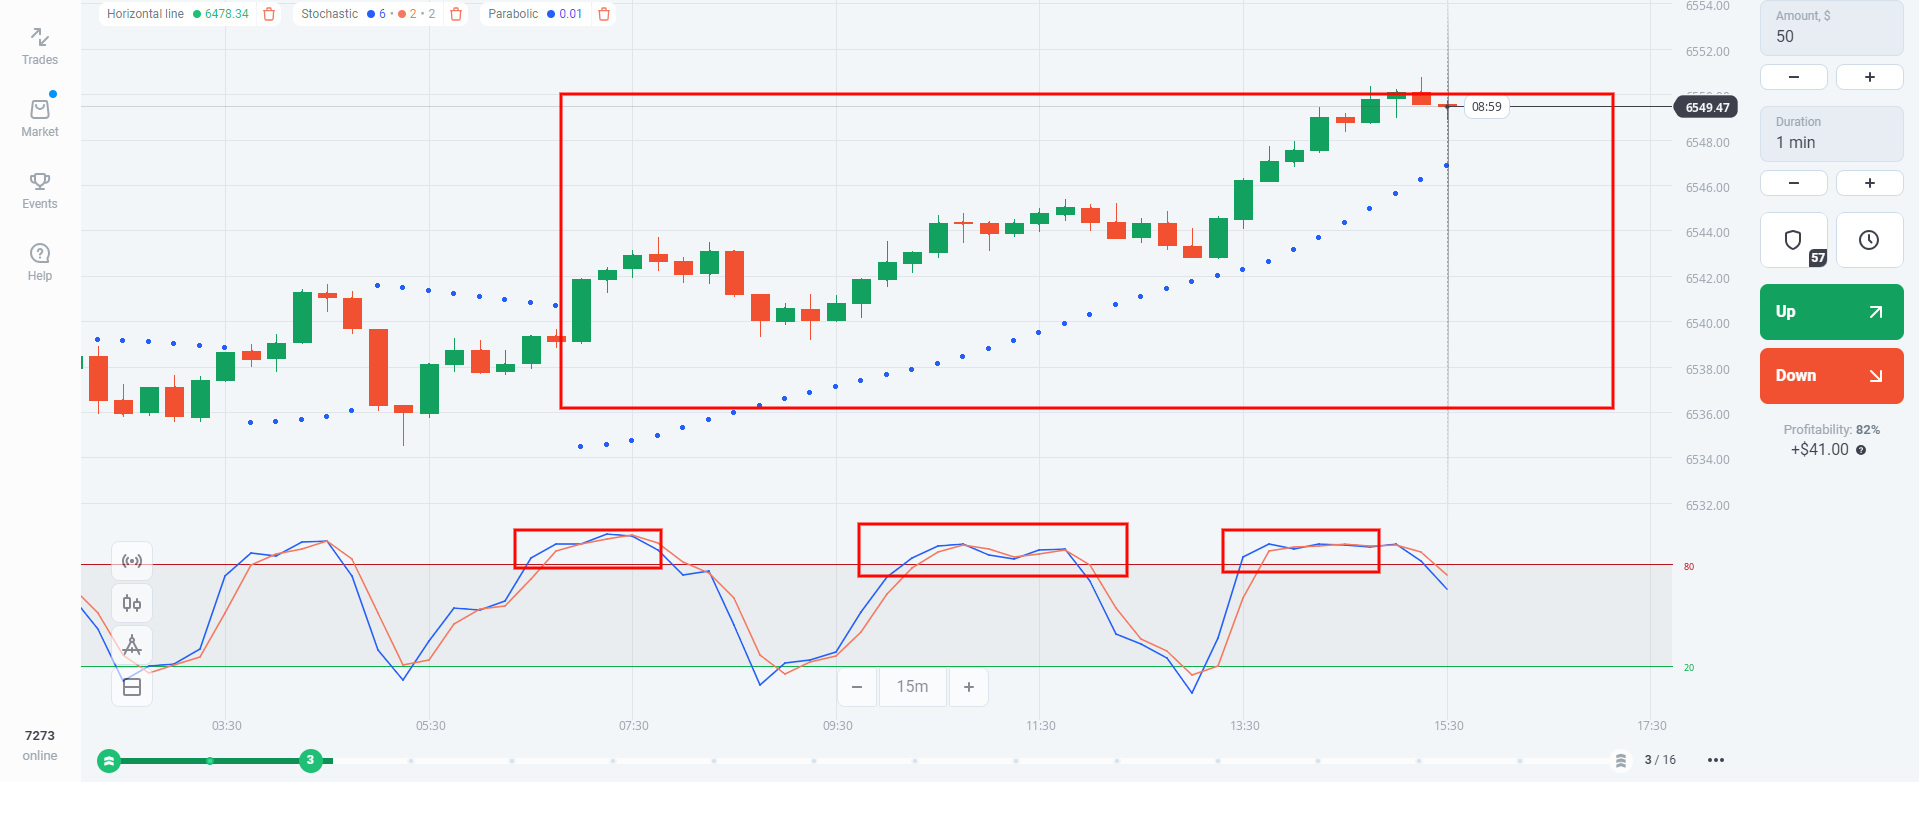
Now, When Parabolic SAR dots are below the price plus the Stochastic Indicator line is near the overbought level you should consider placing a buy trade.

Vice versa, When Parabolic SAR dots are above the price plus the Stochastic Indicator line is near the oversold level you should consider placing a sell trade.
Using Stochastic Indicator Divergence to Trade on Olymp Trade
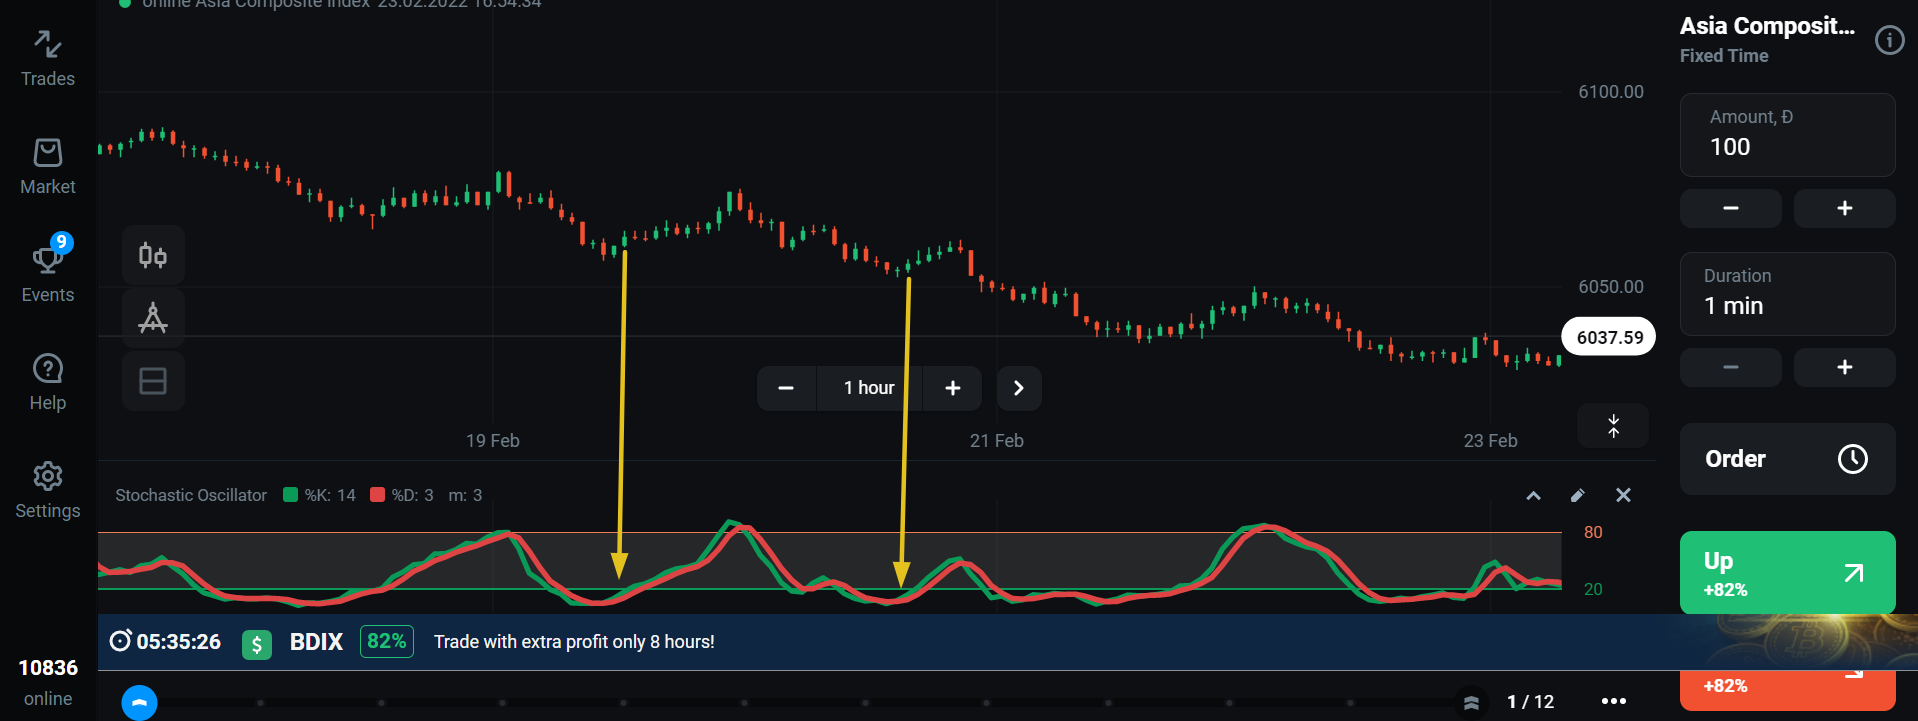
The last and final topic. I want to cover is Stochastic Indicator divergence. Now, what is divergence?
Divergence is a concept that suggests that the price and indicator are moving in the opposite direction and the trend reversal is likely to happen. This usually happens when the price breaks the support/resistance level and you should be very careful at this time. The best thing you can do is not to take any risk and wait for the trend reversal.
The best way to understand and analyse any indicator is by practising and observing the movement of the same in the Olymp Trade practice account. I have shared everything about Stochastic Indicator but it’s now your turn to practice and analyse the same in the practice account. You will get $10, 000 virtual currency in the practice account which is more than enough to make you a pro player in the market.
I wish you the very best of luck!!


