
Signing up is free & takes 5 secs only…
ADX Indicator Basics

ADX or Average Directional Index is a technical analysis tool used by traders to analyse the trend or the strength of the trend. This indicator was developed by J. Welles Wilder. The main aim of this indicator was to help you measure the strength of the price movement in positive or negative directions using +DI or -DI lines.
Here, +DI = Directional Indicator (Positive) is the difference between the current high and the previous high.
-Di = Directional Indicator ( Negative ) is the difference between the current lows and the previous lows.
ADX = The average of +DI and – DI.
Talking about the calculation of the ADX Indicator, ADX Indicator is calculated using a series of Mathematical calculations combining the Simple Moving Average ( SMA ) of a price over a specified period. Firstly, you need to calculate the values of the +DI and – DI lines, followed by the calculation of the ADX line using the Absolute value function and Wilder’s smoothing formula.
How to use the ADX indicator on Olymp Trade?
In order to use ADX Indicator on Olymp Trade, you need to be a member of the Olymp Trade platform. In case, you are not you can also sign up via the form below.
Now, once you have signed up you will land on the Olymp Trade dashboard. firstly, click on the chart button and select Japanese Candlestick from the menu.
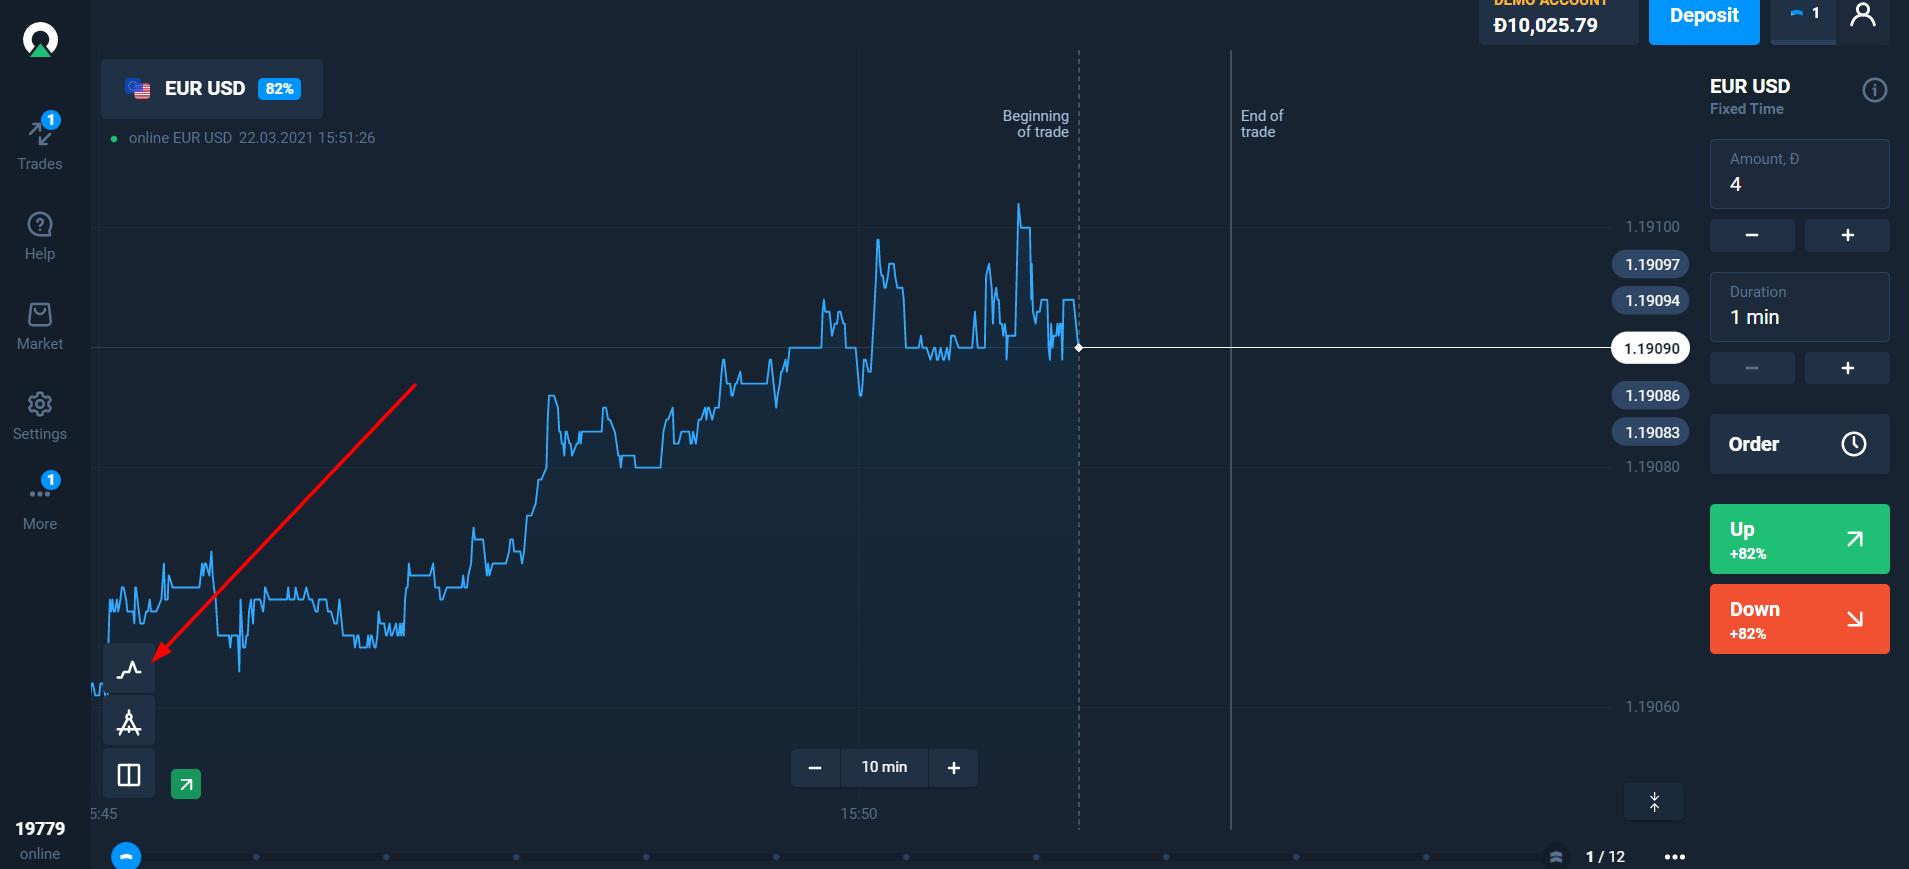
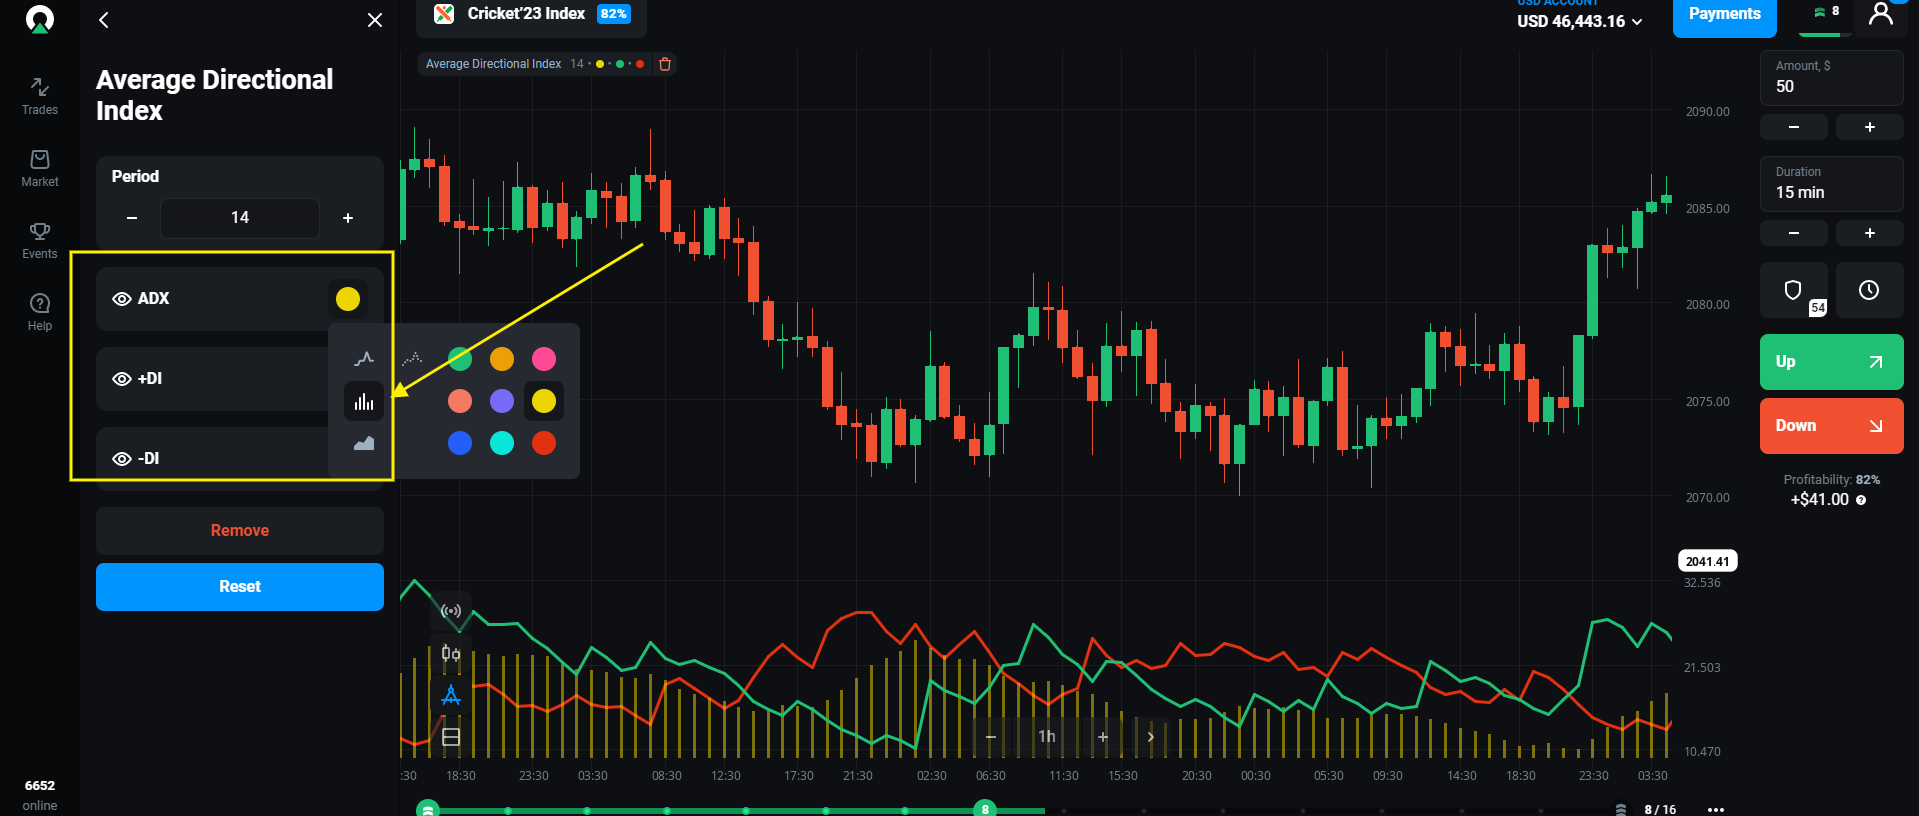
Secondly, click on the Indicator button and select the Average Directional Index from the menu.
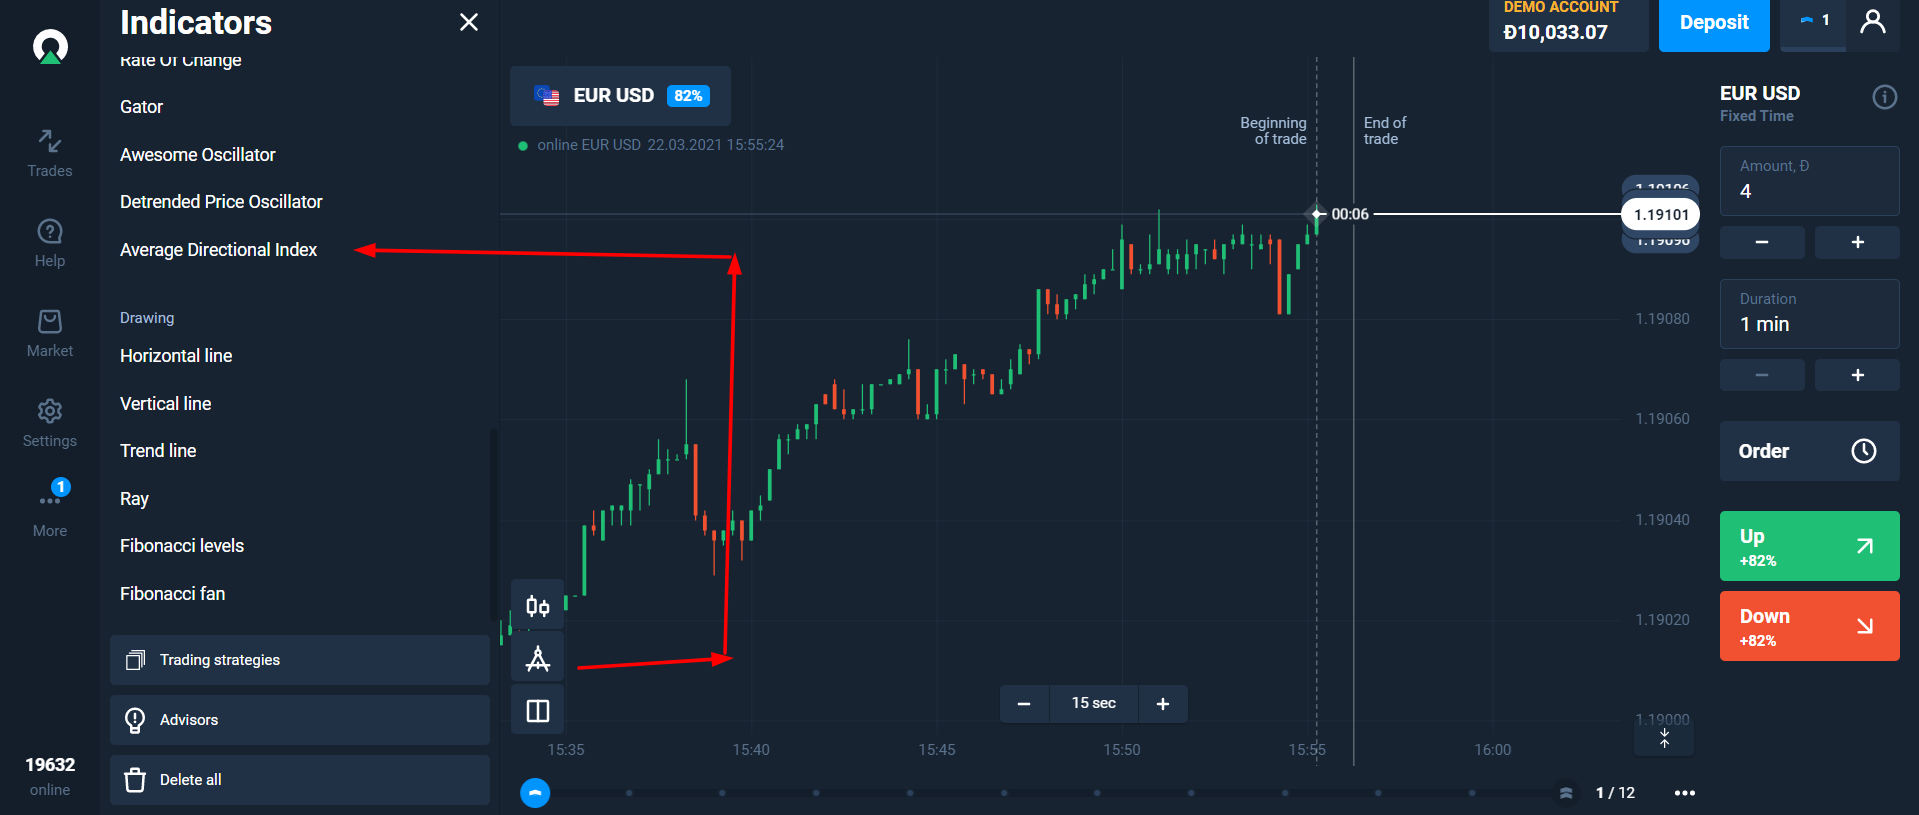
Your dashboard will look something like given below.
You can even the indicator line colours for better clarity. Here, I have changed the colour of +DI line to green and -DI line to red and changed the ADX line to the histogram.
How to place calls using ADX Indicator on Olymp Trade
Finding signals and placing calls using the ADX indicator on Olymp Trade is pretty easy and simple. when the two lines intersect each other it generates buy and sell signals. You can use ADX histogram line to confirm the strength of the trend and place trades accordingly.
Place Buy Trade When
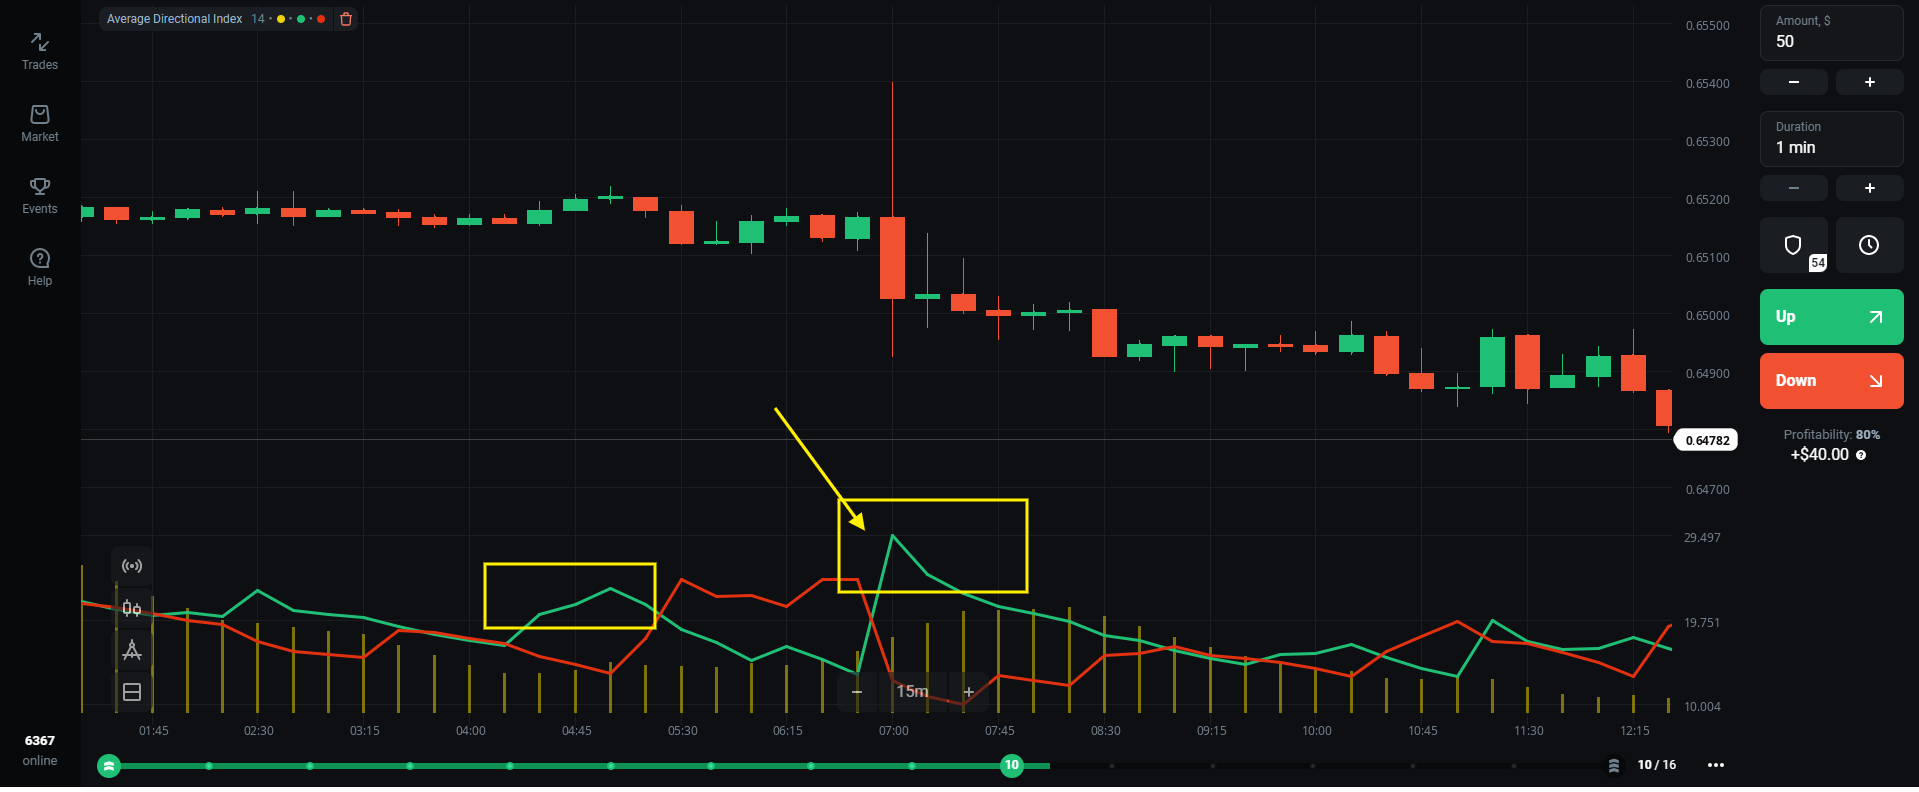
- When the + DI line intersects the – DI line from the bottom and the +DI line is above the – DI line it signals a bullish trend.
- Secondly, The ADX histogram line is in Up rising position. It confirms a strong bullish trend and here you can place a buy trade.
Place Sell Trade When
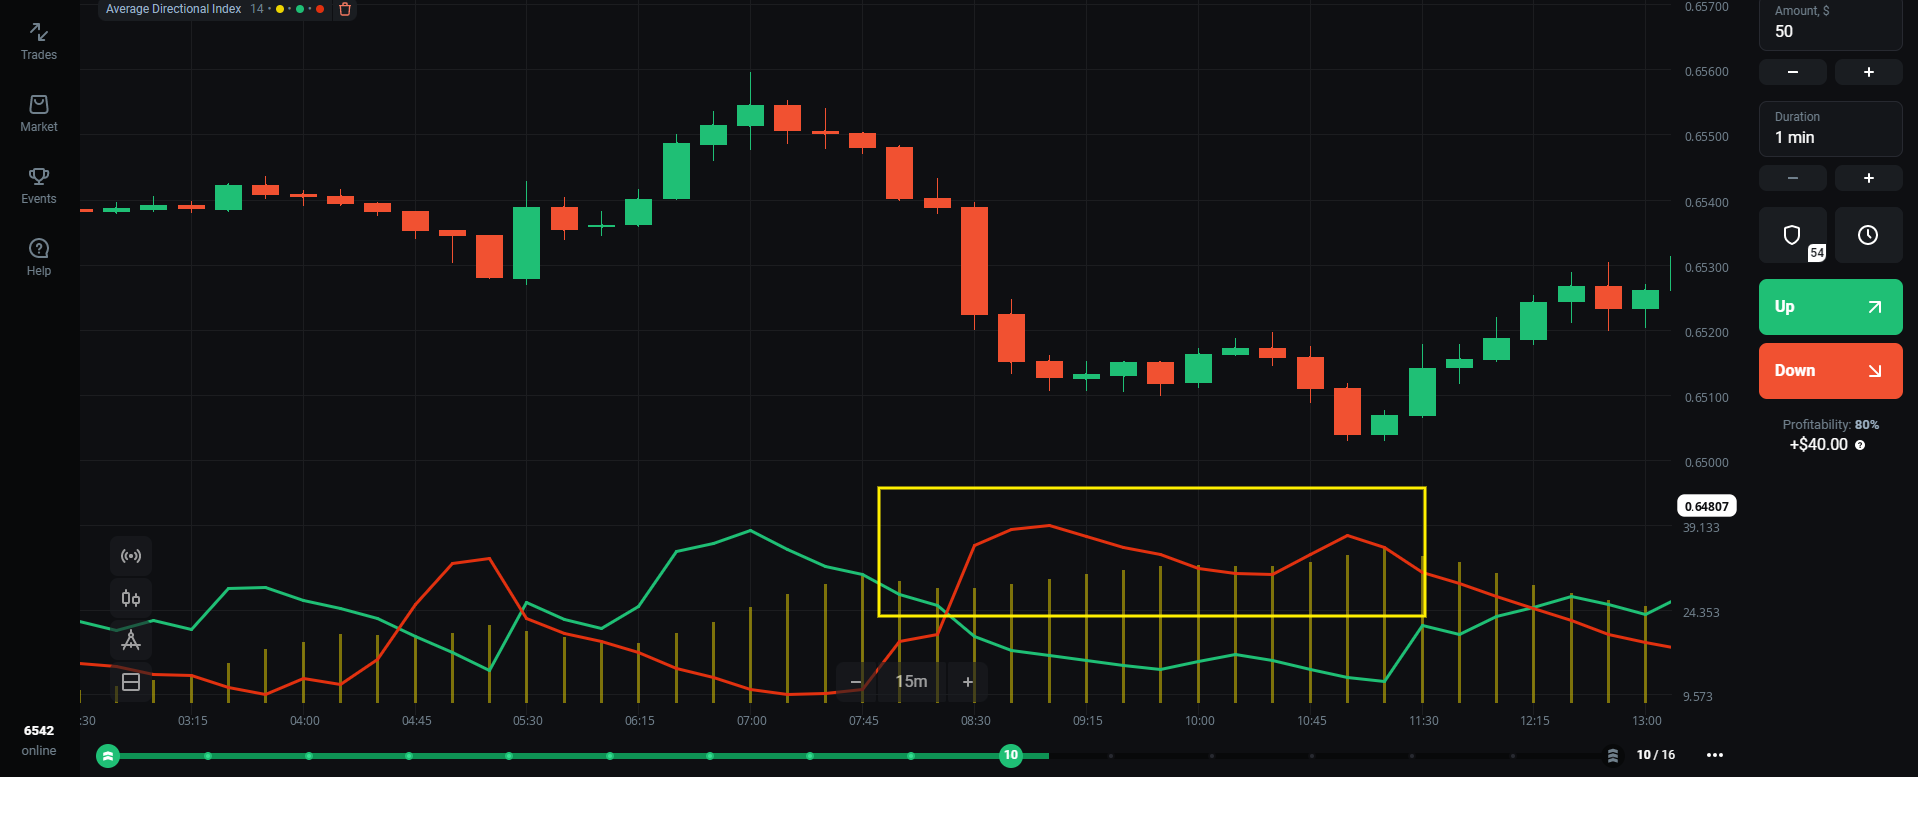
- When the + DI line intersects the – DI line from the top and the +DI line is below the – DI line it signals a bearish trend.
- Secondly, You see big histogram spikes in the uprising position. It confirms a strong bearish trend and here you can place a sell trade.
How I got a 71% result using the ADX indicator
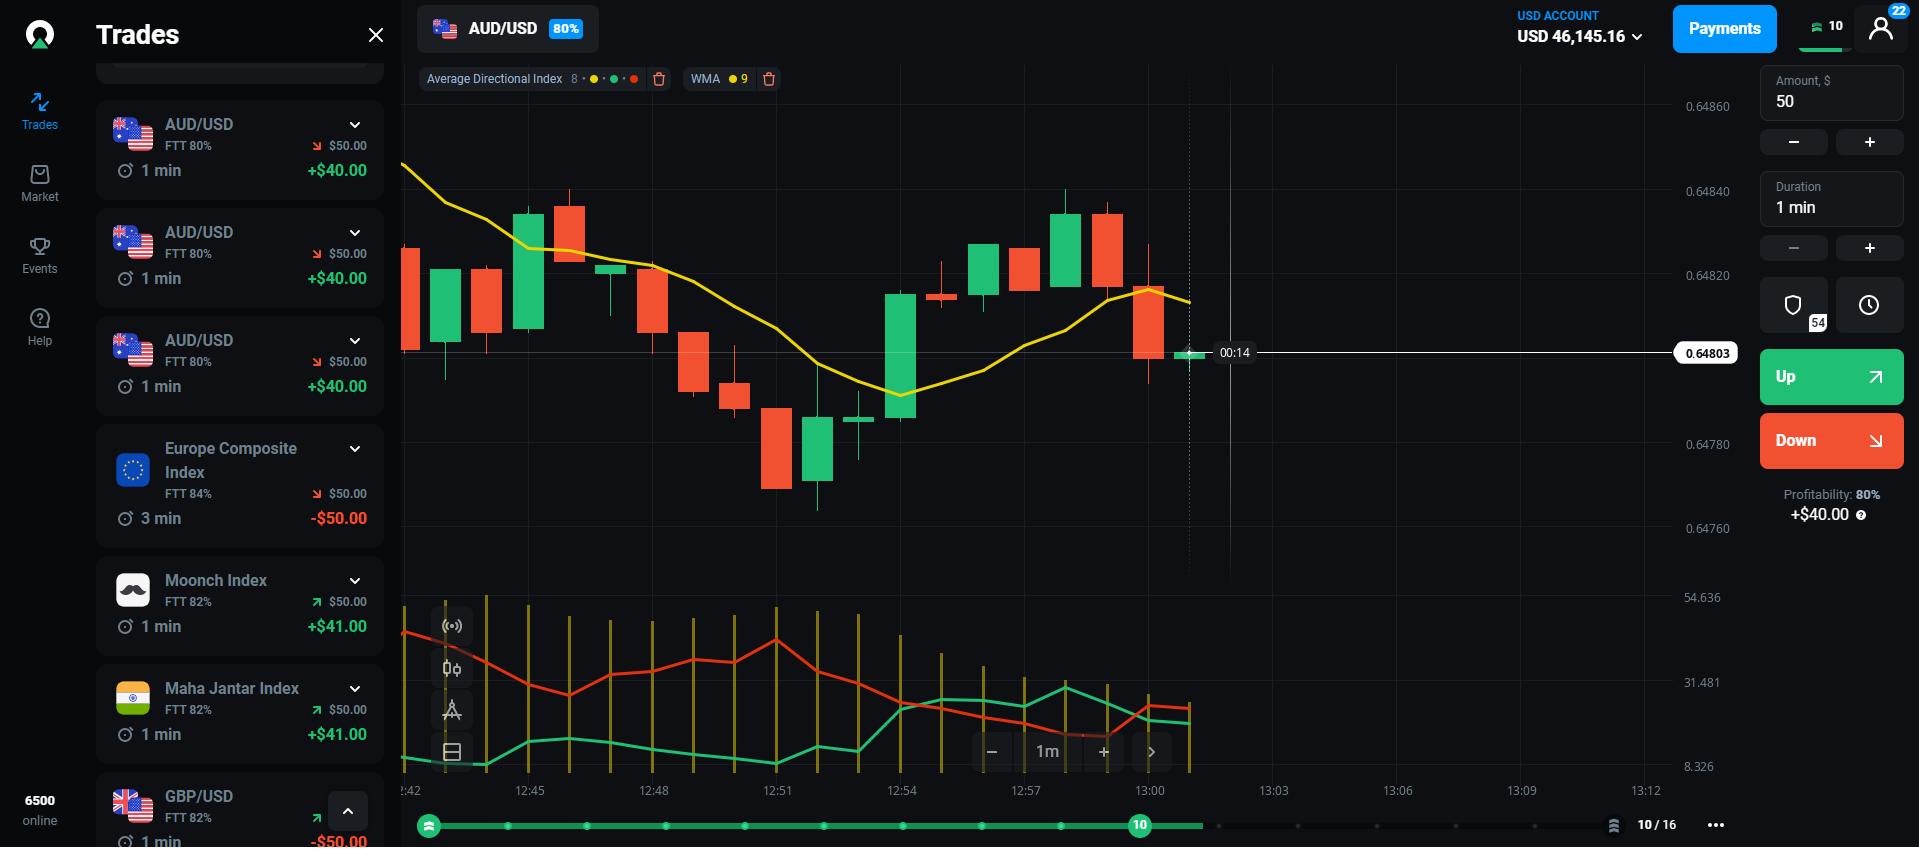
I took about 7 trades using this indicator and I got 5 correct trades with 2 wrong ones which results in about 70%. As I was trading in a 1-minute chart, therefore, I reduced the period of the ADX indicator to 8 and as a trend confirmator, I used WMA which gave me even better signals. WMA is a very powerful indicator and can give you great results. when you have got a buy or sell signal using the ADX indicator you need to confirm it with WMA. when the price intersects below the WMA line it signals a bearish trend and vice versa, when the price intersects above the WMA line it signals a bullish trend.
Try ADX Indicator on Olymp Trade for free