Hello..how are you? in this article I am going to talk about one of the most famous indicators i.e Awesome Oscillator Indicator.
This indicator was developed by Bill Williams and in this article, I will cover everything about the Awesome Oscillator Strategy, Awesome Oscillator formula, & Awesome Oscillator Secret & more.
What is an Awesome Oscillator Indicator?
This is one of my most favourite Indicators. This indicator is really easy to work with and can be used by beginners too.

Awesome Oscillator Indicator is one of the most famous indicators developed by technical analyst and charting enthusiasts Bill Williams.
The awesome indicator combines two moving averages in order to find peaks, trends, and corrections.
This indicator works best in a long time frame like 30 mins, 1-hour chart & more.
Awesome Oscillator Formula
Awesome Oscillator is a 34-period simple moving average, plotted through the central points of bars (H + L /2 ), and is subtracted from the 5-period simple moving average, graphed across the central points of the bars (H + L /2).
Awesome Oscillator Formula= SMA ( Median Price, 5) – SMA ( Median price, 34)
Here,
Median Price= (HIGH + LOW ) /2
SMA = Simple moving average
Period 1 (5) – Number of periods to use for the simple moving average.
Period 2 (34) – Number of periods to use for the second simple moving average.
Period 3 (10) – Number of periods to use for the simple moving average applied to the above 2 moving averages.
How does the Awesome oscillator Indicator works?
To illustrate the Awesome Oscillator Indicator I am going to use Olymp Trade.
Firstly, you need an Olymp Trade account. If you don’t have an Olymp Trade account click here
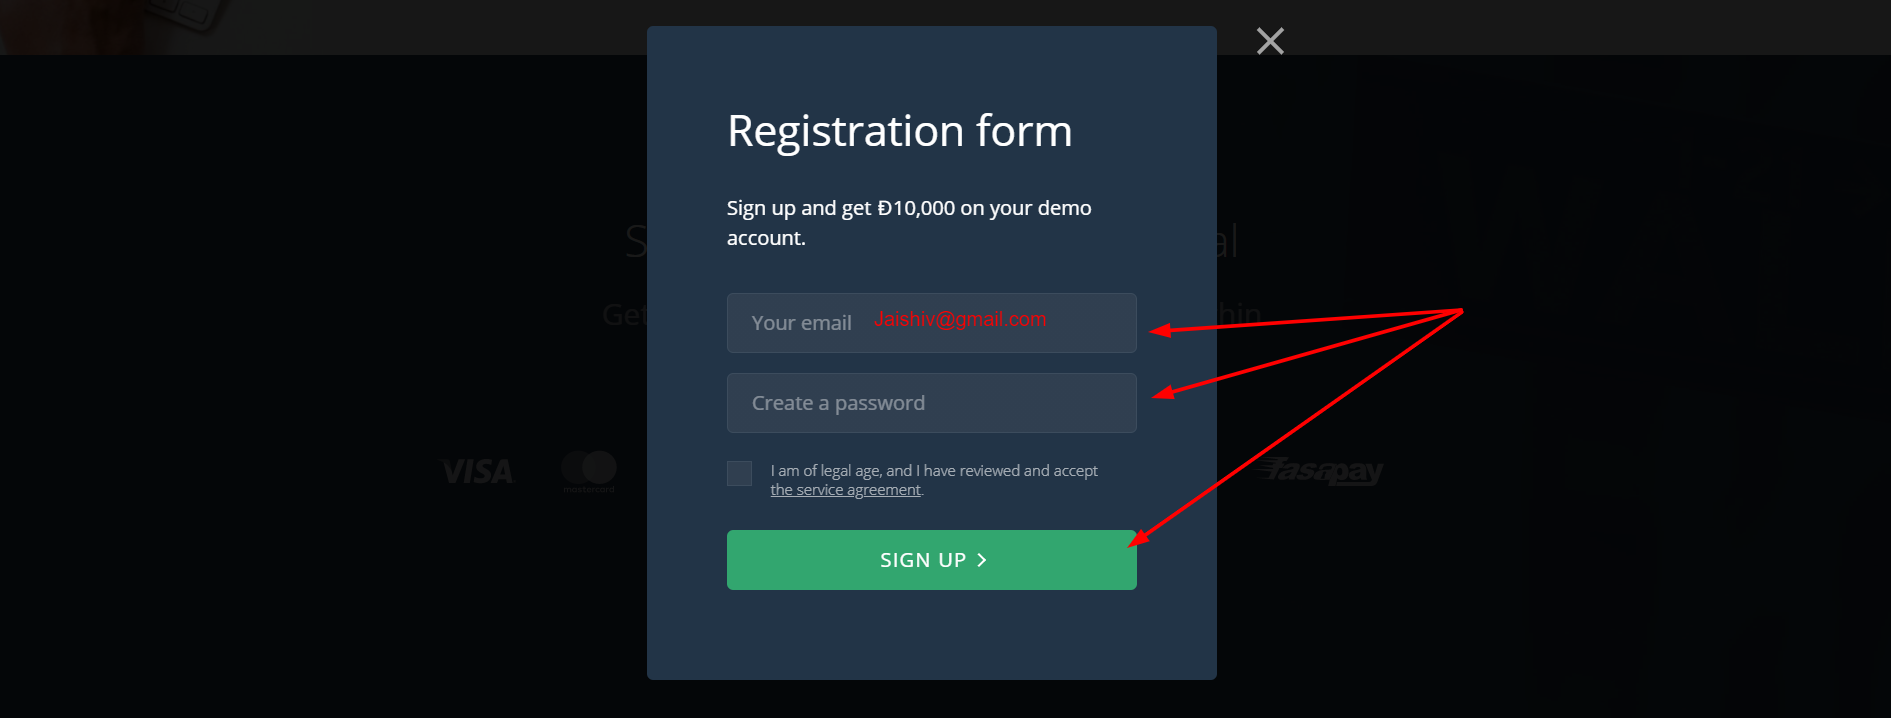
You can also sign up via the form below.
You can sign up via the form above …try…
Firstly, click here and you will land on the Olymp Trade homepage.

Click on Register and fill in your details.

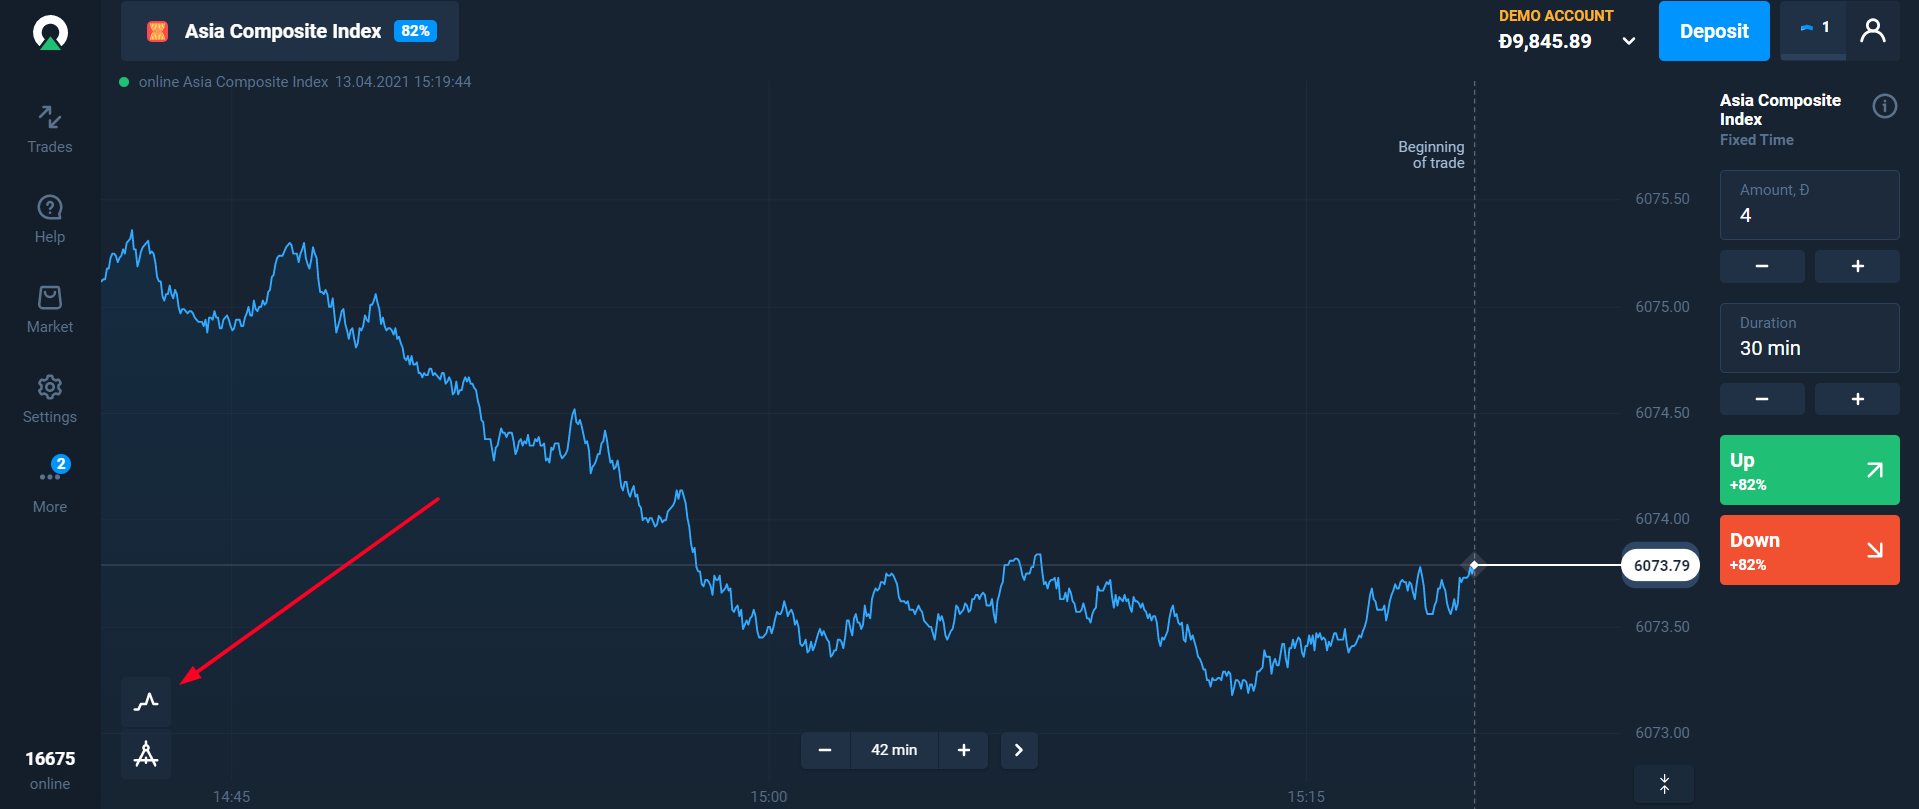
Once you have signed up you will land on the Olymp Trade dashboard. now click on the chart button and select the Japanese candlestick from the menu.
Suggested Read: Cheatsheet on How to read Candlestick chart?
Now, click on the indicator button and select Awesome Oscillator from the menu.
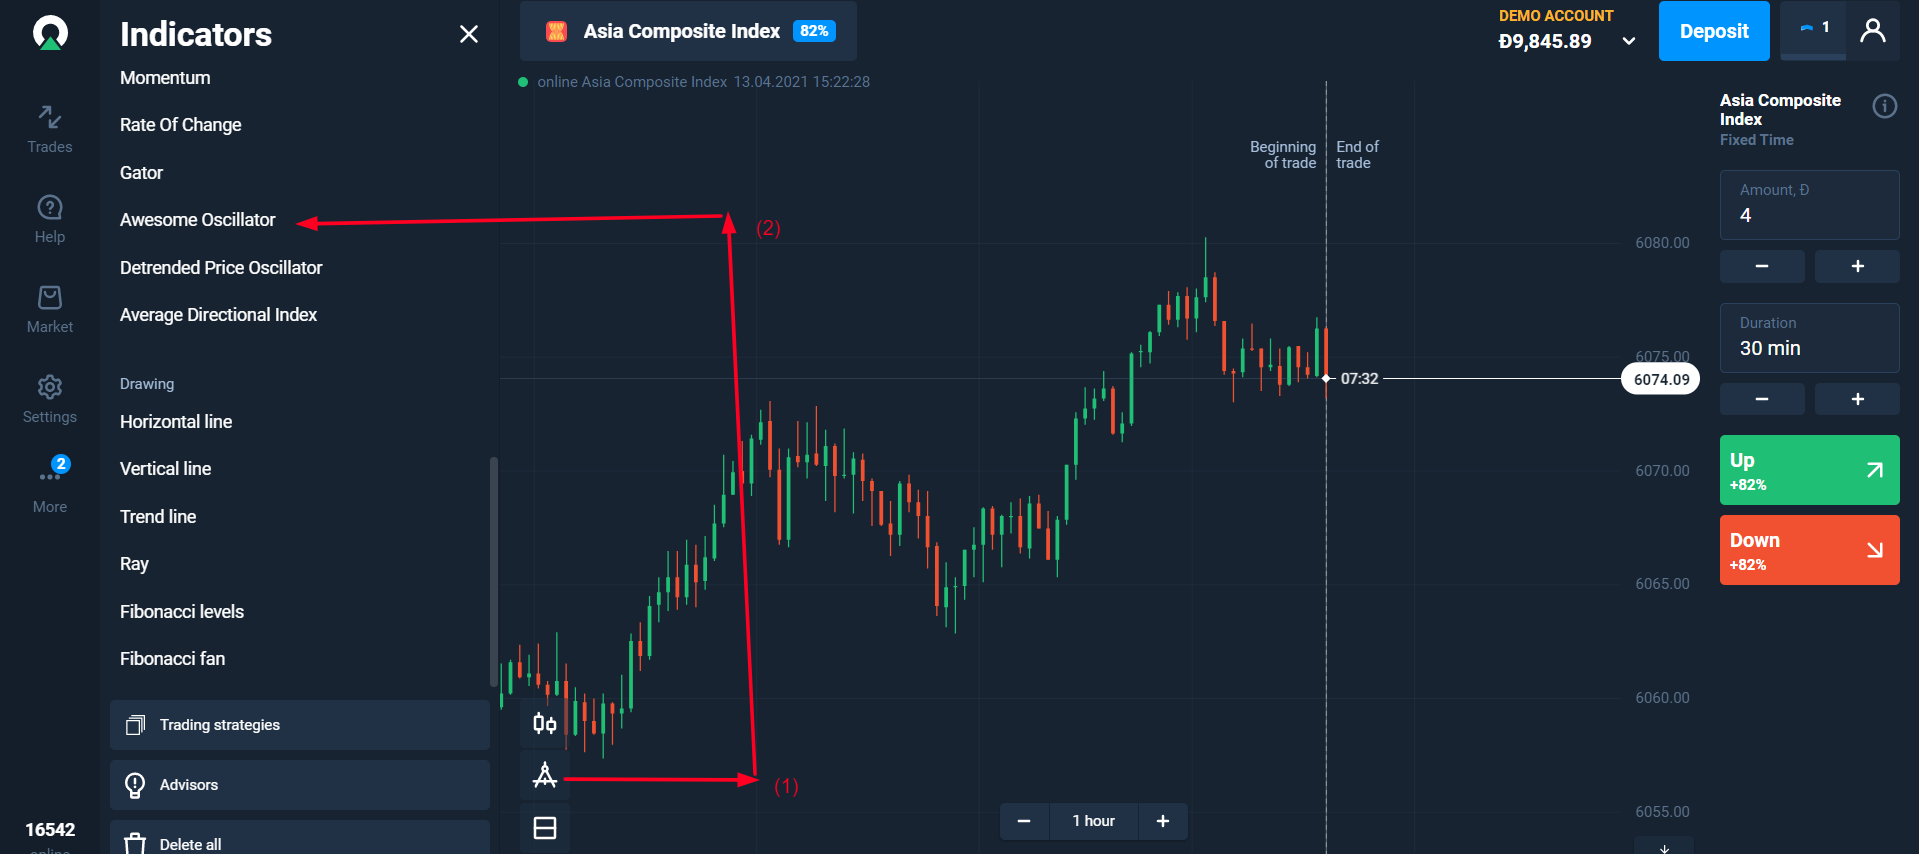
That’s it!! the basic setup is over.
Awesome Oscillator Strategy
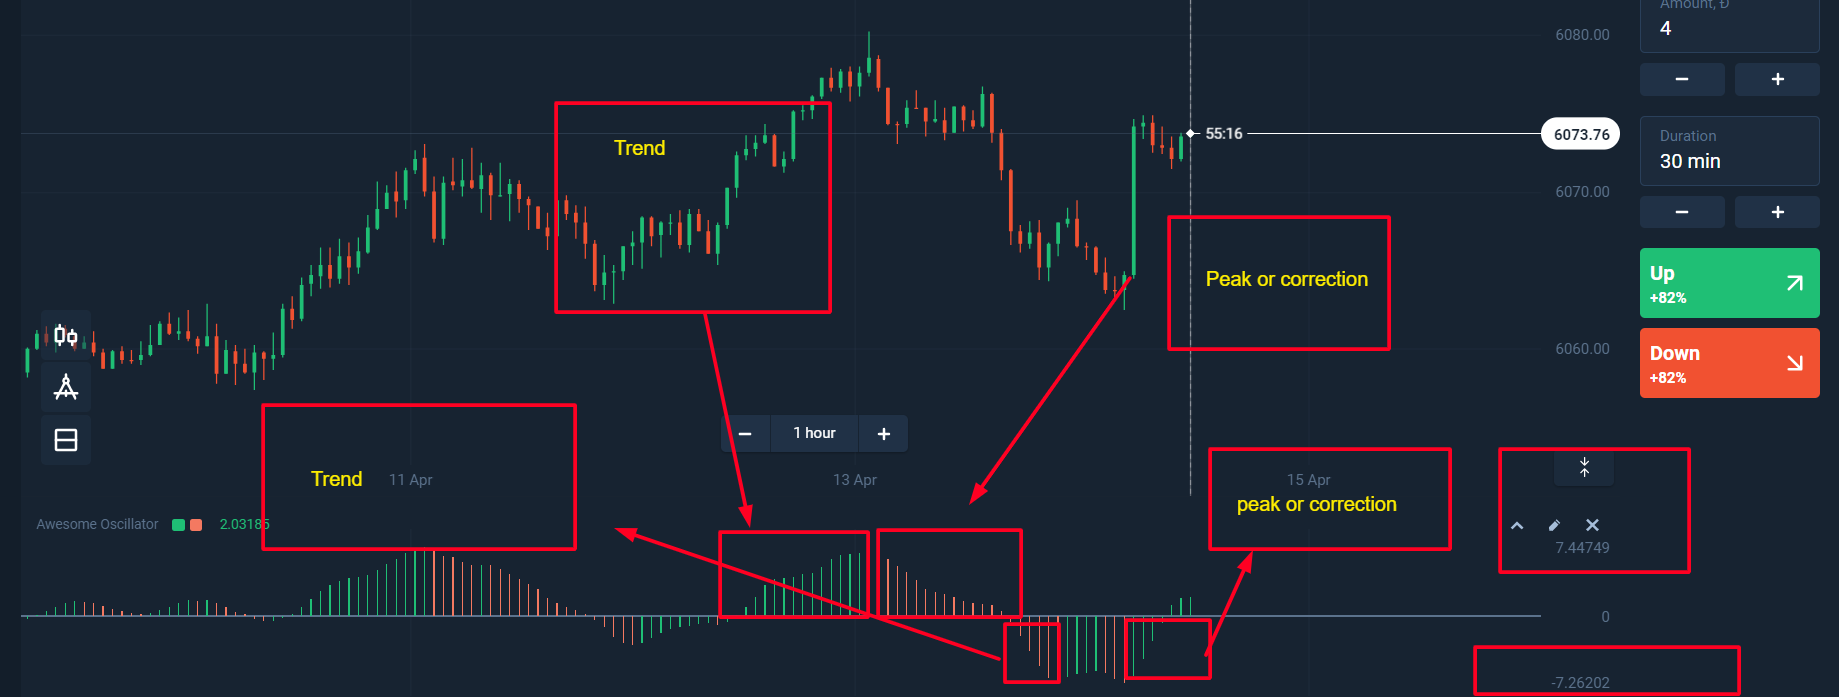
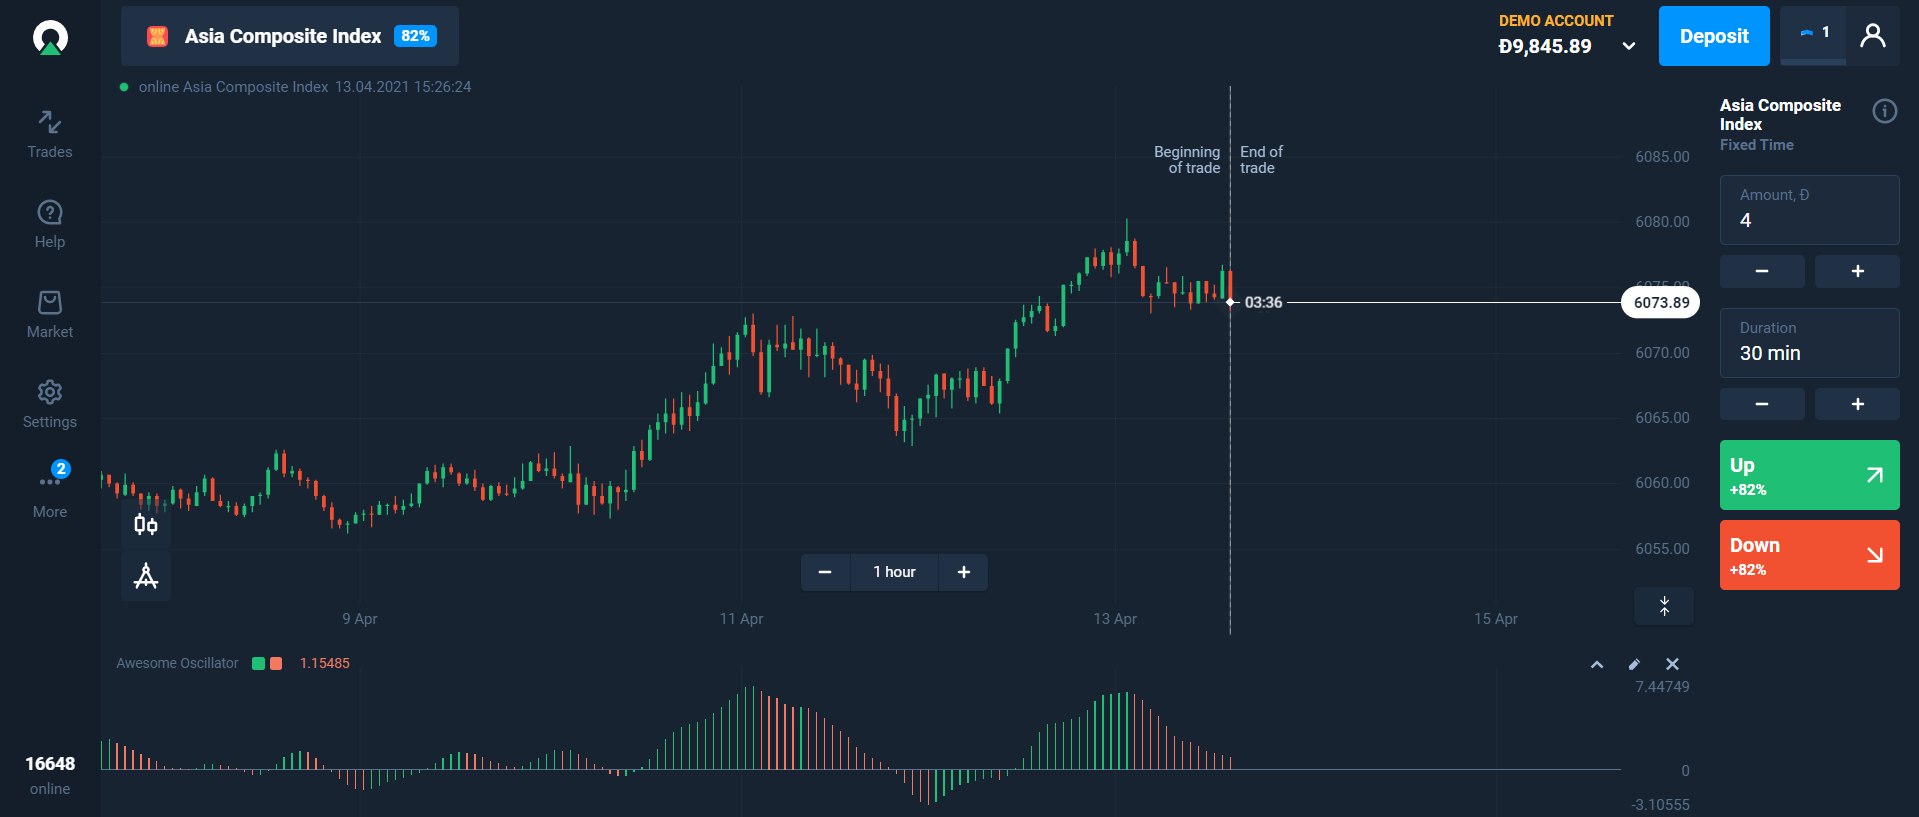
There are basically two lines in Awesome Oscillator i.e:
- 7.447: It shows a bullish trend
- -7.447: It shows a bearish trend.
The golden rule of the Awesome Oscillator Strategy says:
If we see continuous green spikes in line 7.447 that means the market is in a bullish trend and here we should go for BUY trade.
****************************************************************
Similarly, If we see continuous red spikes in line -7.447 it means that means the market is in a bearish trend and here we should go for a SELL trade.
Example:
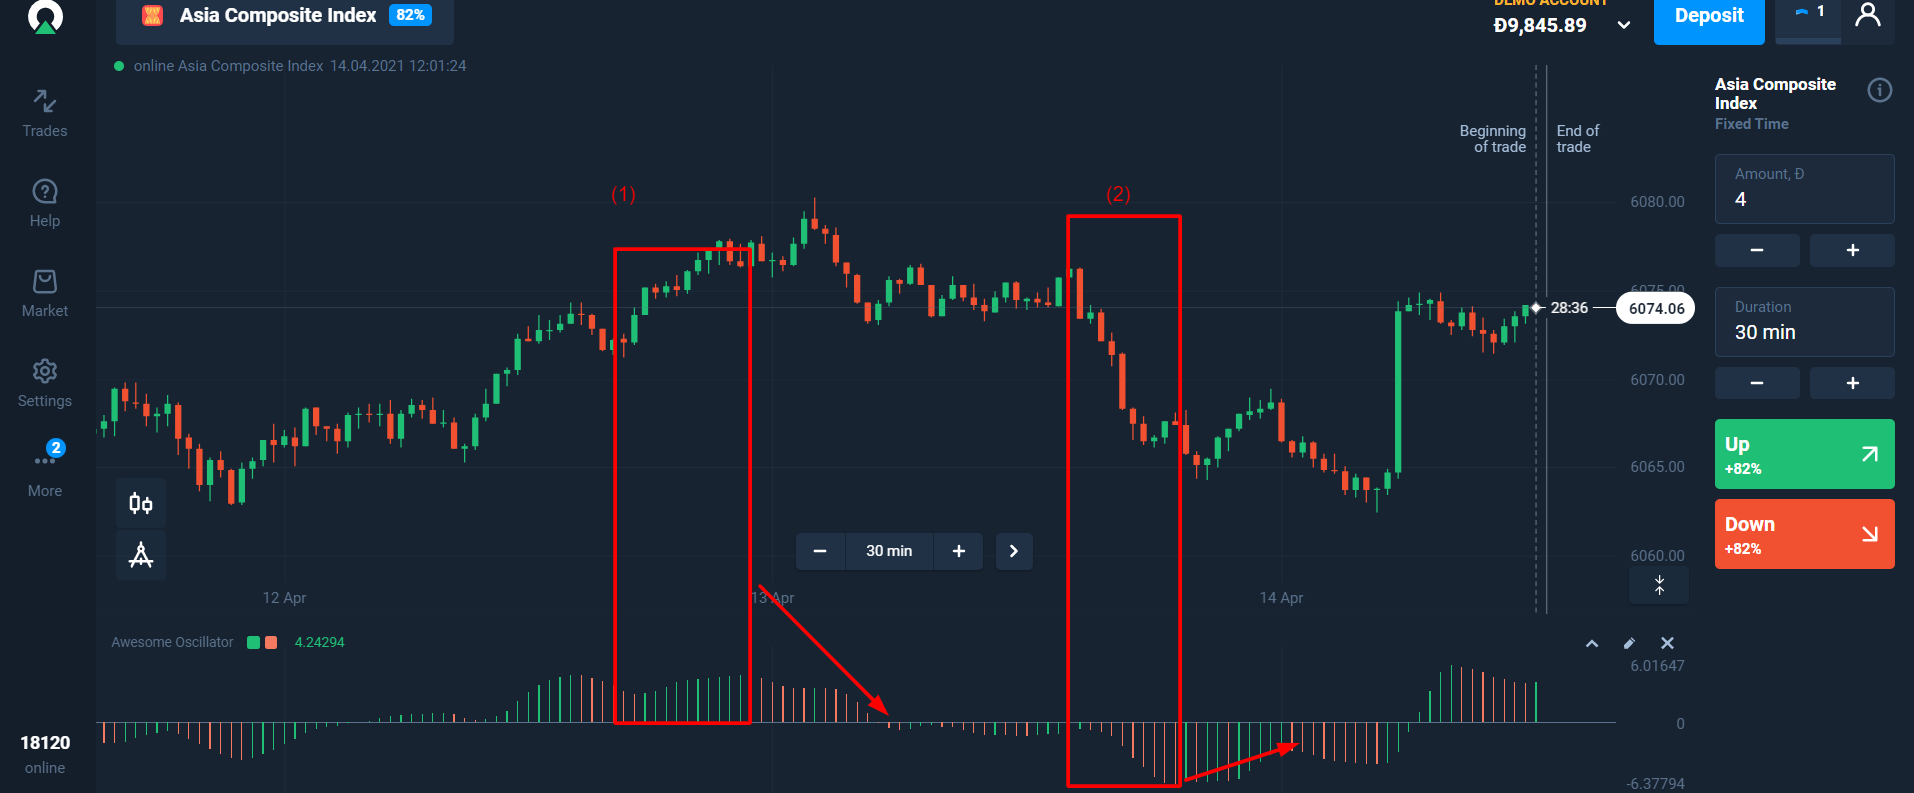
At point number (1) we can see clear green spikes in the +7.447. so here, we can go for Buy Trade.
Similarly, at point number (2) we can see clear red spikes in the line -7.447. so, here we can go for SELL Trade.
That’s it!! It is so easy to trade with an Awesome Oscillator Indicator.
However, If you want to gain better results. use support and resistance.
Homework: Check your knowledge
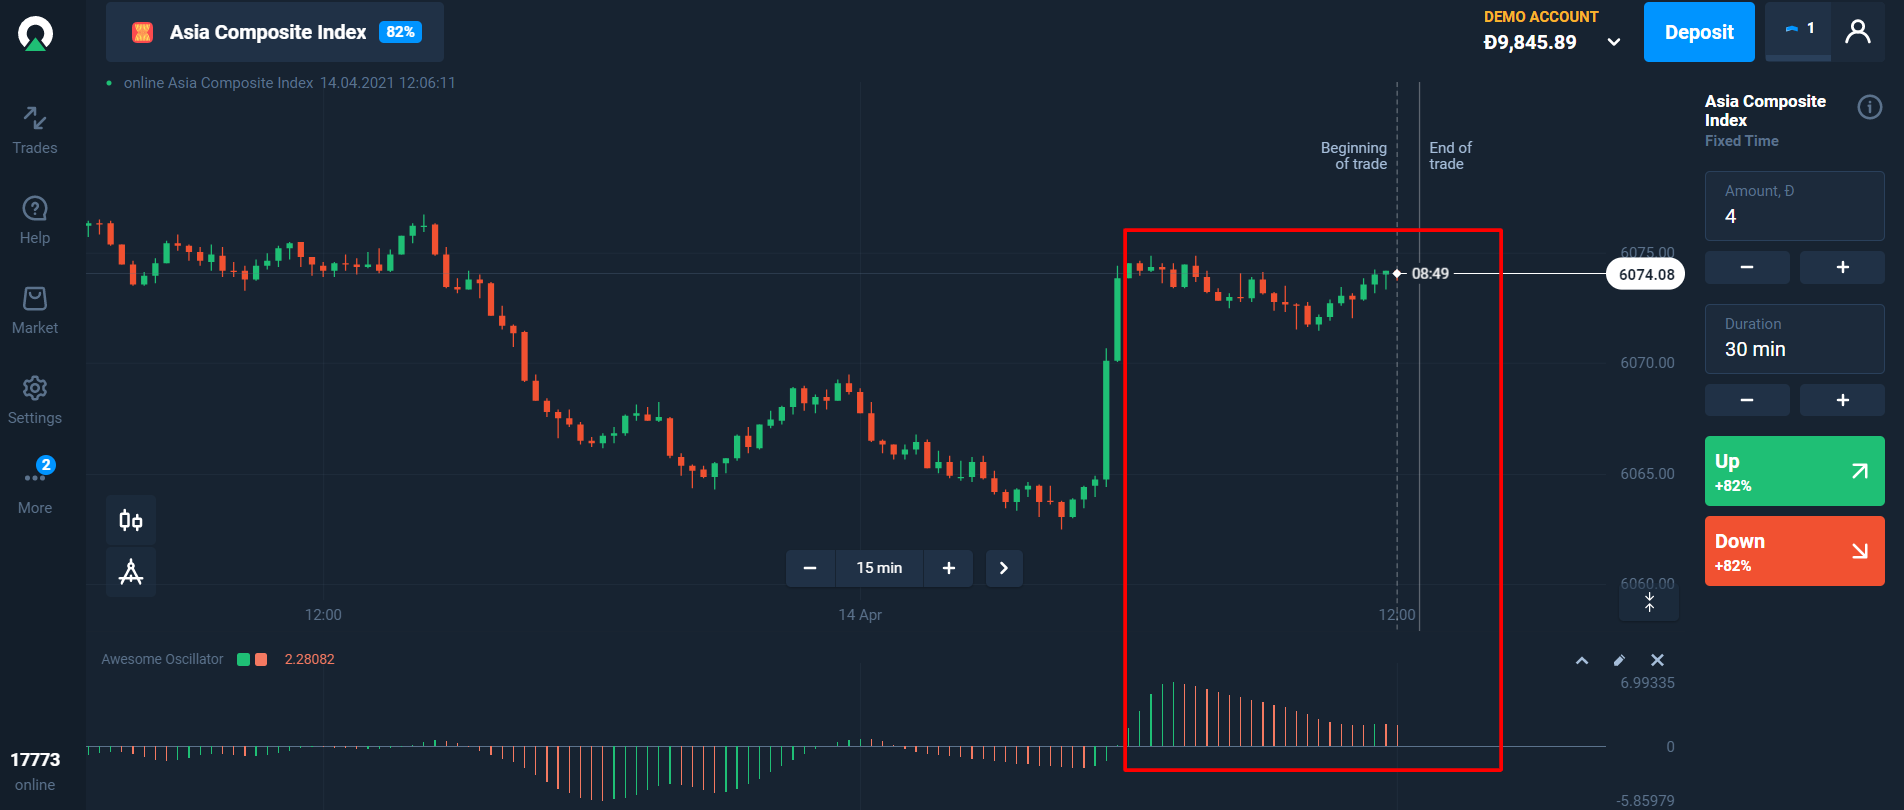
See the chart above and comment below or mail me at Honestdigitalreview@gmail.com which trade should you take here?
Winding Up:
So, this is the end of this article I hope you have found this article helpful.
This article was all about Awesome Oscillator Indicator Strategy, Awesome Oscillator Indicator Settings, What is an Awesome Oscillator Indicator?
