Signing up is free & takes 5 secs only…
Hello…how are you?
Well, today in this article I am going to talk about one of the most famous indicators i.e William % R indicator.
William % R indicator alone is one of the most powerful indicators that I have seen However, in this article, I will teach you a perfect William % R SMA strategy that will give you even better results.
What is Williams % R indicator?
The William % R indicator, also known as the percentage range is a momentum indicator that moves between 0 – 100.
Just like RSI, Williams % R helps us to spot overbought and oversold levels.
History:

William % R indicator was founded by Larry Williams in the 1987 world cup championship.
This event was organized by Robin Trading company. where Larry Sir made $10, 000 to $1,100000 within 12 months.

Later his daughter, Michelle Williams who is also an actress won the contest in 1997.
Williams % R indicator Formula: How do you calculate William % R
William % r indicator = Highest high – close / Highest high – Lowest low
Here,
Highest high = Highest price at the lookback period, typically 14 days.
Close: Most recent closing price.
Lowest Low: Lowest price in the lookback period typically 14 days.
How does William % R work?
To illustrate William % R Strategy, Here I will use Olymp Trade. If you don’t have an Olymp Trade account yet Click Here.
You can sign up here try…
Now, once you have signed up you will land on the Olymp Trade dashboard.

Firstly, click on the chart button and select Japanese candlestick from the menu.

Suggested: Cheatsheet to read Japanese Candlestick properly

Secondly, select SMA twice from the indicator menu.

Now, change one simple moving average to 7 and the other to 14 and darken the line to green and red for more clarity.

Thirdly, go to indicator again and select William % R from the menu.
That’s it the basic setup is over and now your dashboard will look something like given below.

William % R SMA Strategy
Understanding, William % R Strategy is damn very easy.
First of all, here I assume that you know at least the basics of Support and Resistance. If you don’t know click here.
Now, The golden rule of William % R SMA Strategy says:
If SMA 7 and SMA 14 intersect each other and both SMA and William % R show a bullish trend then we should go for BUY Trade.
*****************************************************************
Similarly, If SMA 7 and SMA 14 intersect each other and both SMA and William % R show a bearish trend then we should go for SELL Trade.
Example:
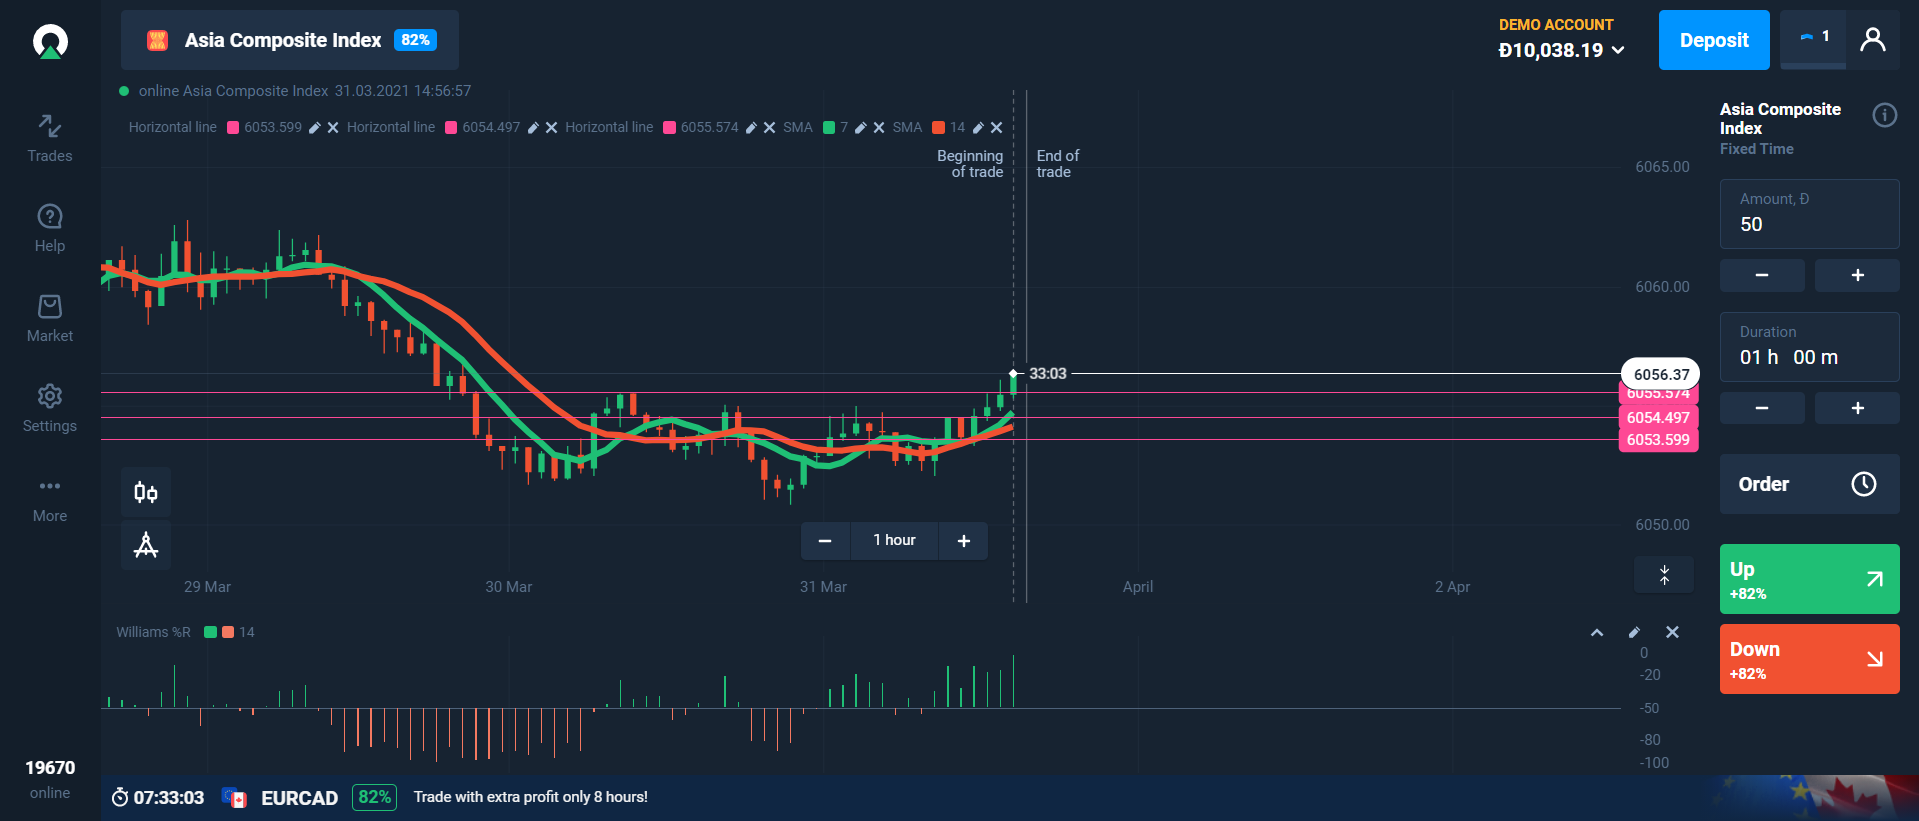
Given above is a one hour chart, both SMA 7 and SMA 14 intersect each other both SMA and William % R and support level shows a bullish trend then we should go for BUY Trade
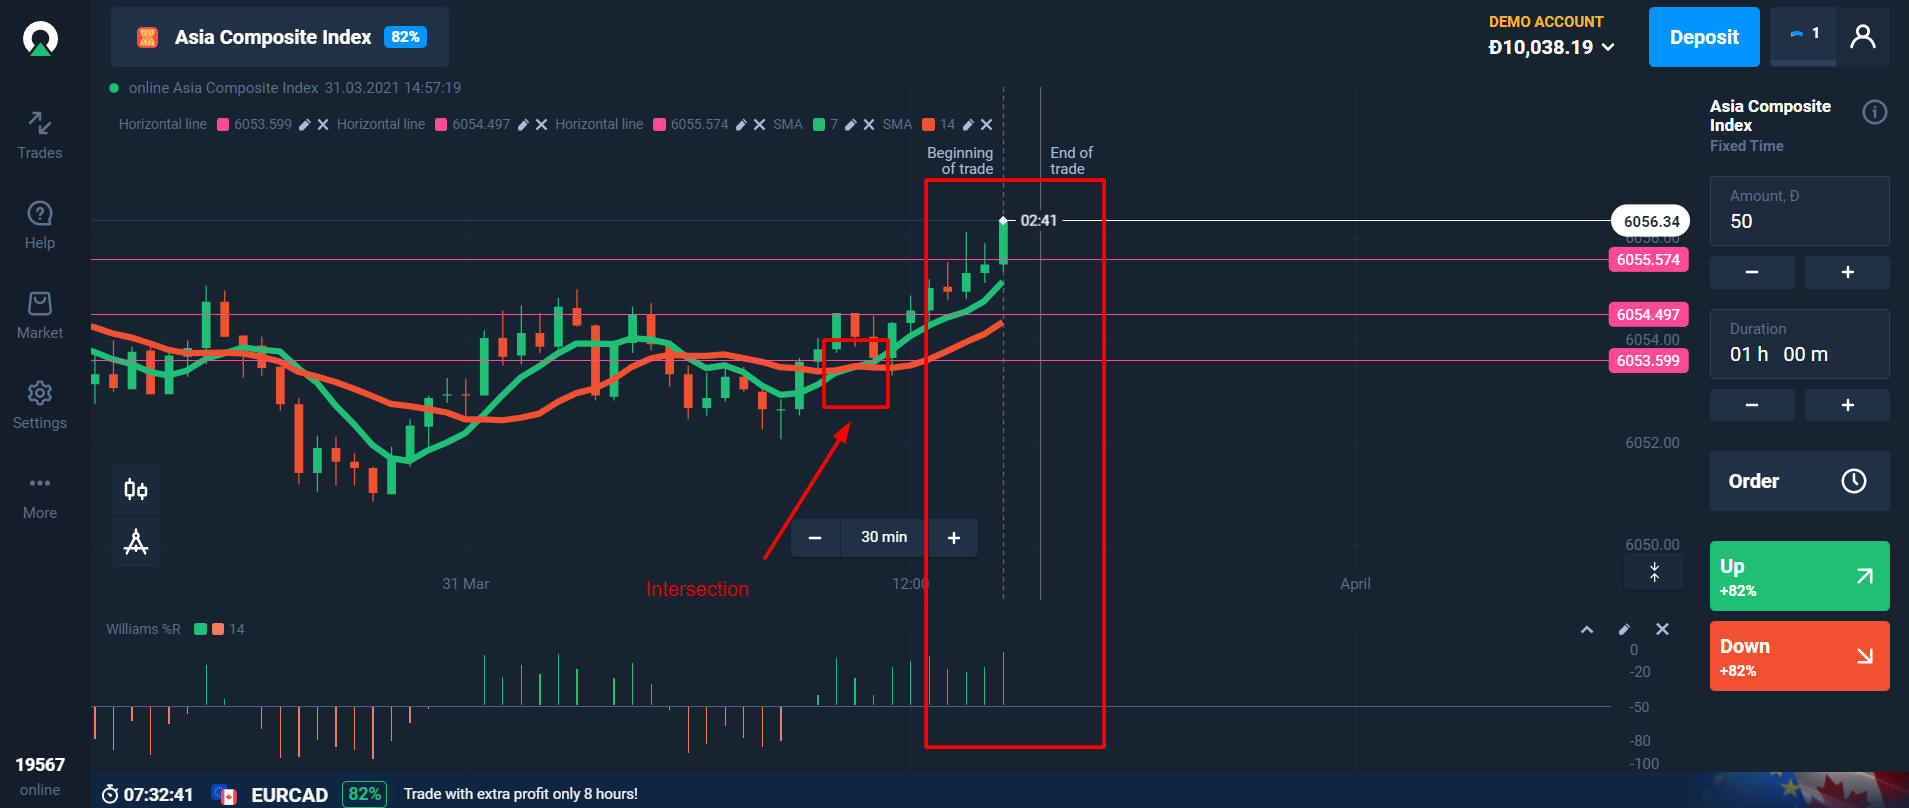
Given above is a 30 minutes chart, both SMA 7 and SMA 14 intersect each other both SMA and William % R and support level shows a bullish trend then we should go for BUY Trade
Winding Up:
I hope you have found this article helpful. and you have understood the concept.
if you still have any problem mail me at Honestdigitalreview@gmail.com or comment below.
Till then, Best of Luck 🙂
