Signing up is free and takes 5 secs only…
MACD or Moving average convergence divergence, invented in 1979 by Gerald Appel, is one of the most popular technical indicators that Olymp Trade offers. In this article, I will cover everything about the indicator.
How to find and set MACD indicator at Olymp Trade

To set moving average convergence divergence indicator at Olymp Trade. Log in to your Olymp Trade first => Click on the chart button and select candlestick from the menu => next click on the indicator box => search for the name MACD in the menu => select the name from the menu.
About Moving average convergence divergence
- Moving average convergence divergence is a trend-following momentum indicator that is made from the combination of the moving averages of a security price.
- The Indicator is made from the four most important lines. name Macd line, signal line, zero line, & histogram.
- The Macd line is the difference between 12 days and 26 days EMA.
- The Signal line is the 9 days EMA of the Macd line whereas the histogram is the difference between the Macd line and the signal line.
- The default settings for the indicator is 12, 26, and 9.
MACD Strategy: How to trade with MACD indicator
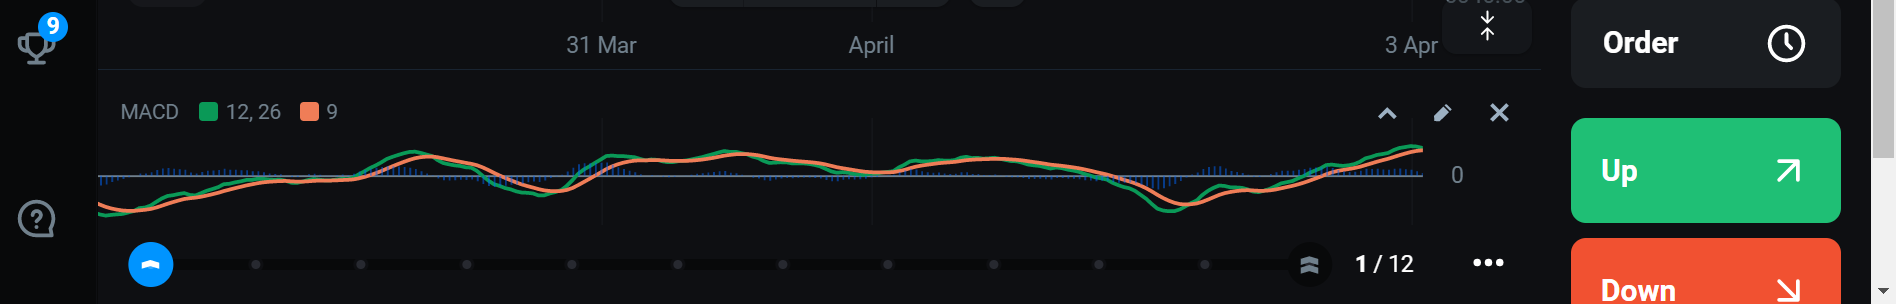
As you can see above there are two lines that move around the histogram. The green line is the Macd line and the red line is the signal line. The green and the red line moves around the histogram and the moment they intersect each other is a time of buy and sell signals.
If you study the indicator properly you will surely notice a 0 line on the right-hand side. The main job of this line is to help you verify the strength of the trend whereas the histogram helps to identify the positive or negative divergence.

Place a buy trade with MACD bullish crossover

When the green line (Macd line) and the red line (Signal line) intersect each other below the line 0 => and the green line stays above the red line it signals a bullish trend => However, you should place a buy trade only when the bullish crossover moves above the line 0.
Open a sell trade with MACD bearish crossover

When the red line and green line intersect each other => and later the red line is more dominant and is above the green line => is a signal of a bearish trend => Place a sell trade only when the bearish intersection moves below the line 0.
MACD divergence at Olymp Trade

Macd divergence is a concept that suggests that the indicator and price are not cooperating with each other. They are moving in an opposite direction this usually happens due to the fluctuations in the market. If you notice a Macd divergence you should wait for the trend to become clear.
You have just gained the knowledge about MACD indicator. This is one of the most powerful indicators. You can also combine this indicator with support and resistance. If you have found a bullish trend using the MACD indicator check if the price is near the support level and similarly when you find a bearish trend using the MACD indicator plus if the price is near the resistance level it signals a strong bearish trend and here we can place a sell trade. The best way to learn this strategy is to start practising this strategy in the Olymp Trade demo account and move to a real account once you are confident enough.
