

Donchian Channel is one of the most widely used trend indicators that you can easily find on the Olymp Trade trading platform. In this blog, I will cover everything about the Donchian channel and how you can use the indicator properly on the Olymp Trade platform plus I will also provide my live results with this indicator.
Understanding Donchian Channel

The Donchian Channel is a popular trend indicator that was developed by Richard Donchian, a very popular name in the field of trading. The Donchian channel is a trend indicator that helps us to analyse the security price and predict upcoming price movements. This indicator is made from the composition of three moving average lines i.e. midline, upper line and lower line. The price of security oscillates around these three lines which helps us to predict the upcoming trend and reversals.
The upper line in the indicator represents the highest price achieved by security over a specified period of time while the lower line represents the lowest price achieved by security over a specified period of time and the midline is the median between the upper and lower line.
Donchian Channel Formula
Upper Line (UC) = Highest high in N periods
Lower Line (LC)= Lower low in N periods
Midline = ( Upper line + Lower line) / 2
Where,
UC = Upper channel
N = Number of minutes, hours, days, weeks, months.
Periods = minutes, hours, days, weeks, months.
LC = Lower channel.
Configure the Donchian channel on the Olymp Trade trading platform
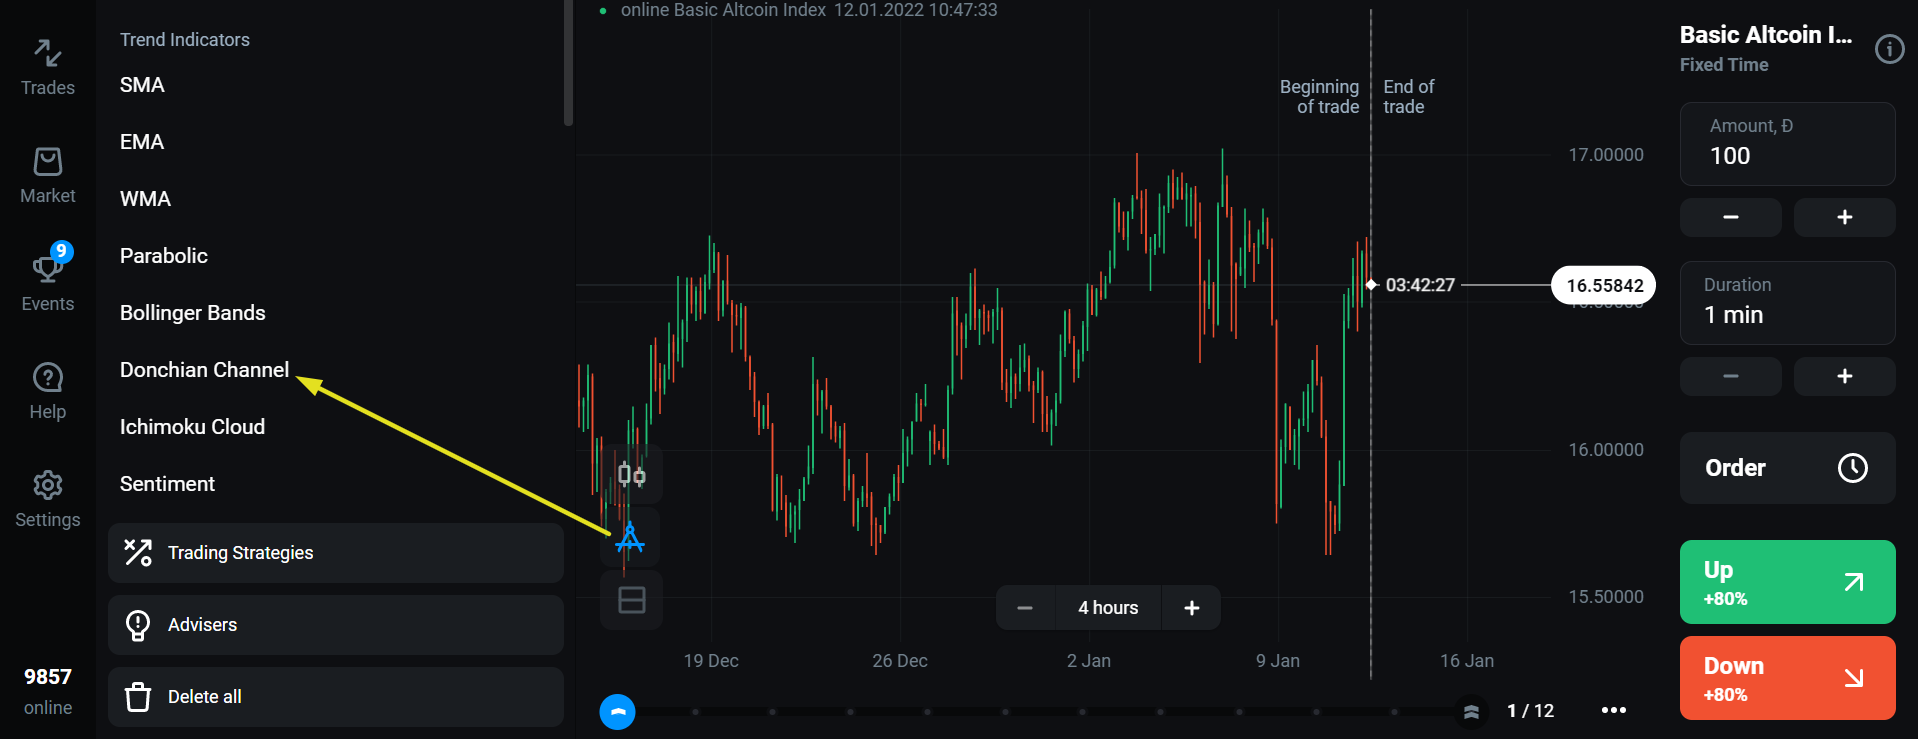
Setting up the Donchian channel on the Olymp Trade is very easy. Once you logged in firstly click on the indicator button.
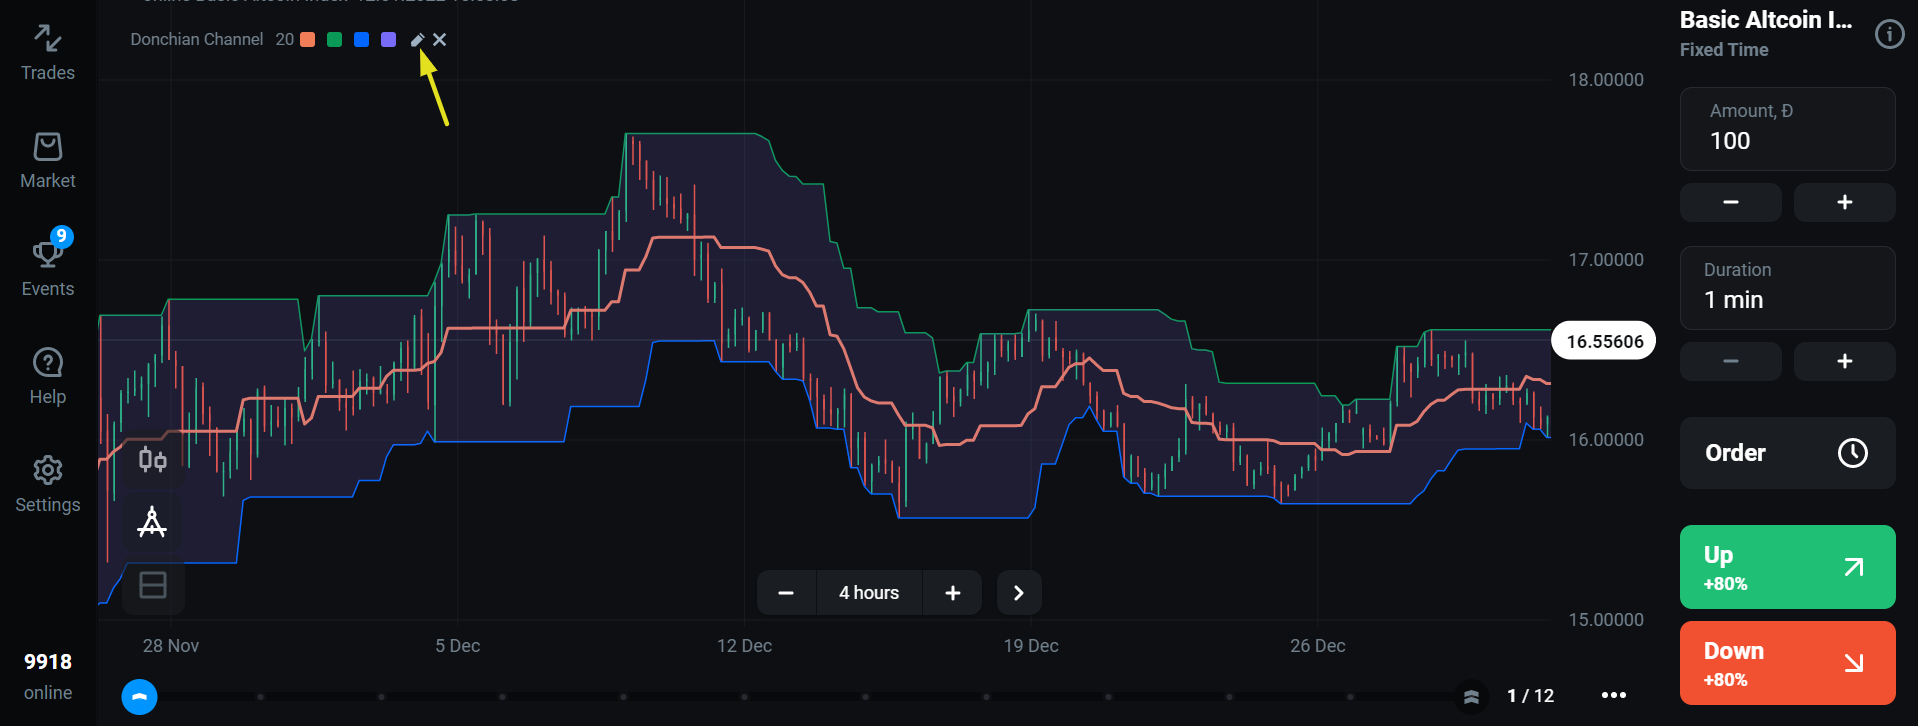
You can always adjust the period, thickness, and colours of lines by clicking on the pencil icon.
Donchian channel Strategy: How to place effective trades using the Donchian channel
Trading with the Donchian channel is very easy. You just need to remember the golden rule: The golden rule of the Dochian channel says:
When the price close near the lower line it signals an upcoming bullish trend and here you can consider placing a buy trade. Similarly, When the price opens near the upper line it signals an upcoming bearish trend and here you can consider placing a sell trade
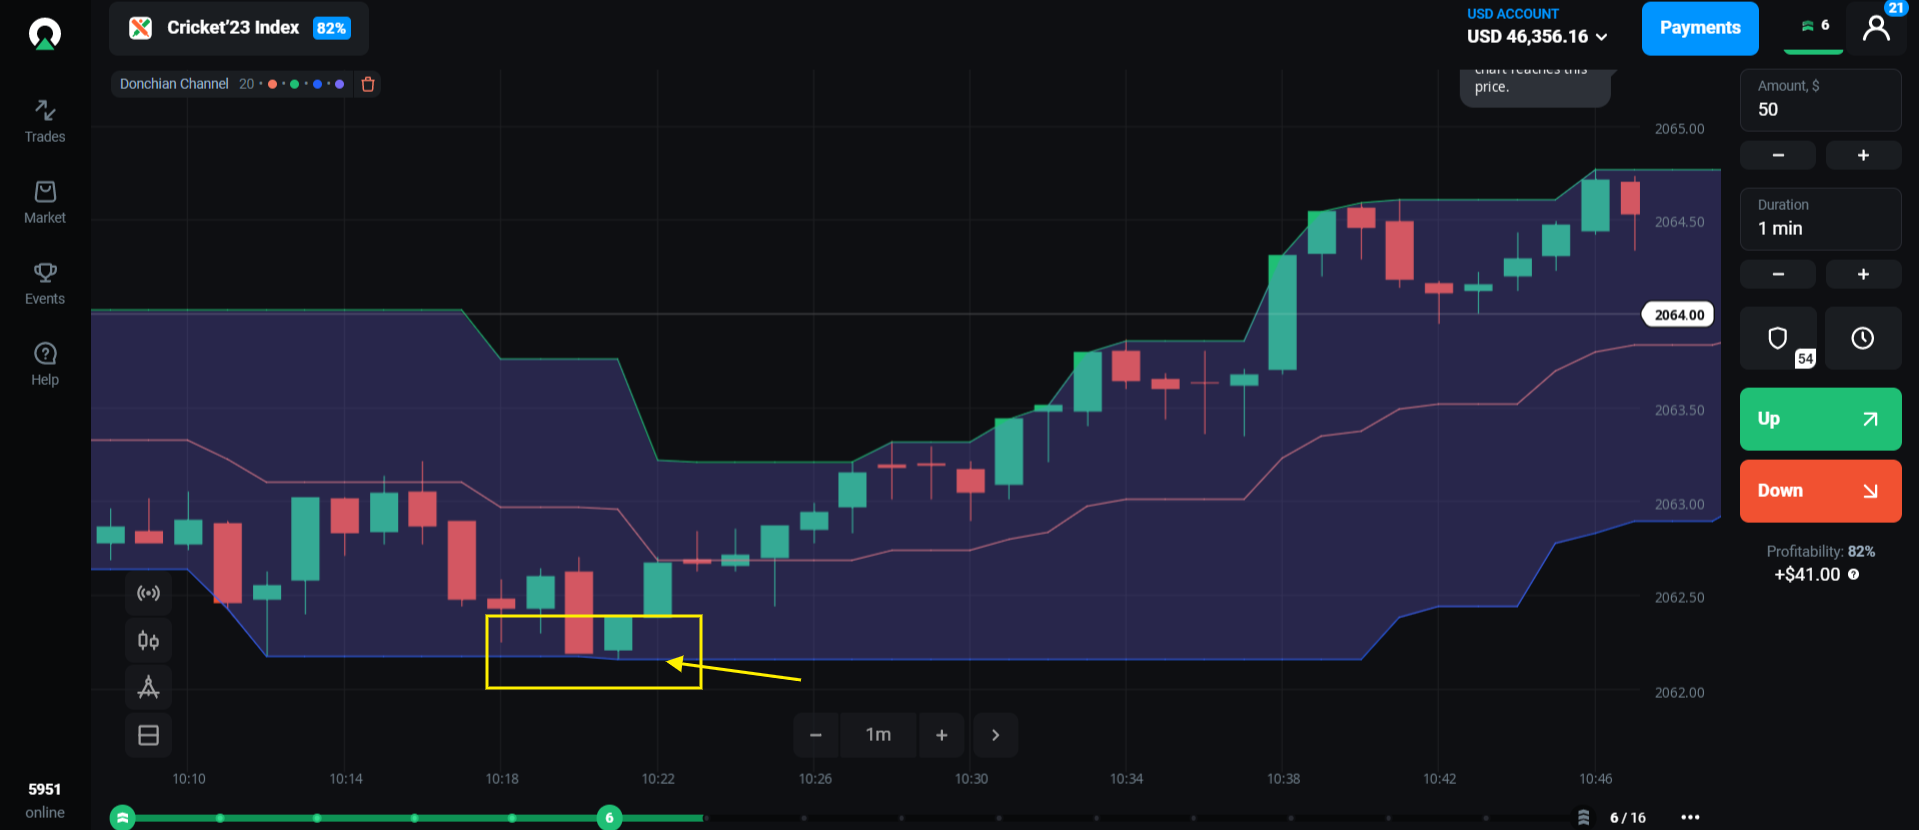
Given above is a 1-hour chart of Cricket’ 23 Index and we can clearly see that the price is closing near the lower line of the indicator. so, here you can consider placing a sell trade.
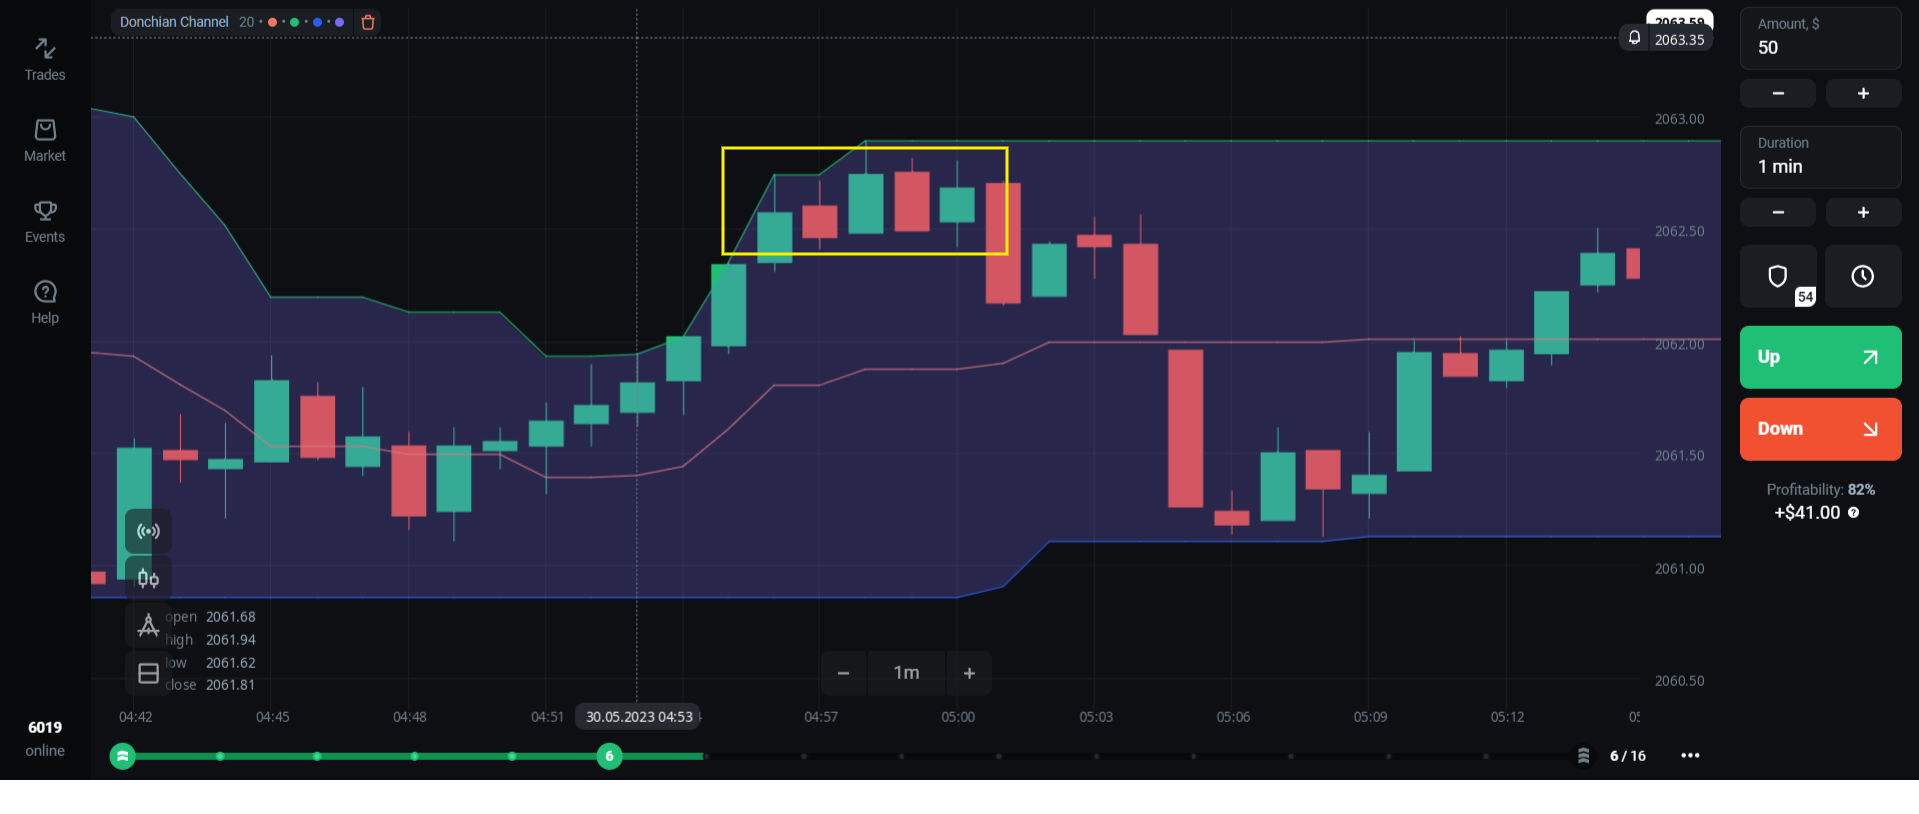
Similarly, Given above is the 1-hour chart of Cricket’ 23 Index and we can clearly see the price opening near the upper line of the indicator, here we can consider placing a sell trade.
My Trading results with Donchian Channel
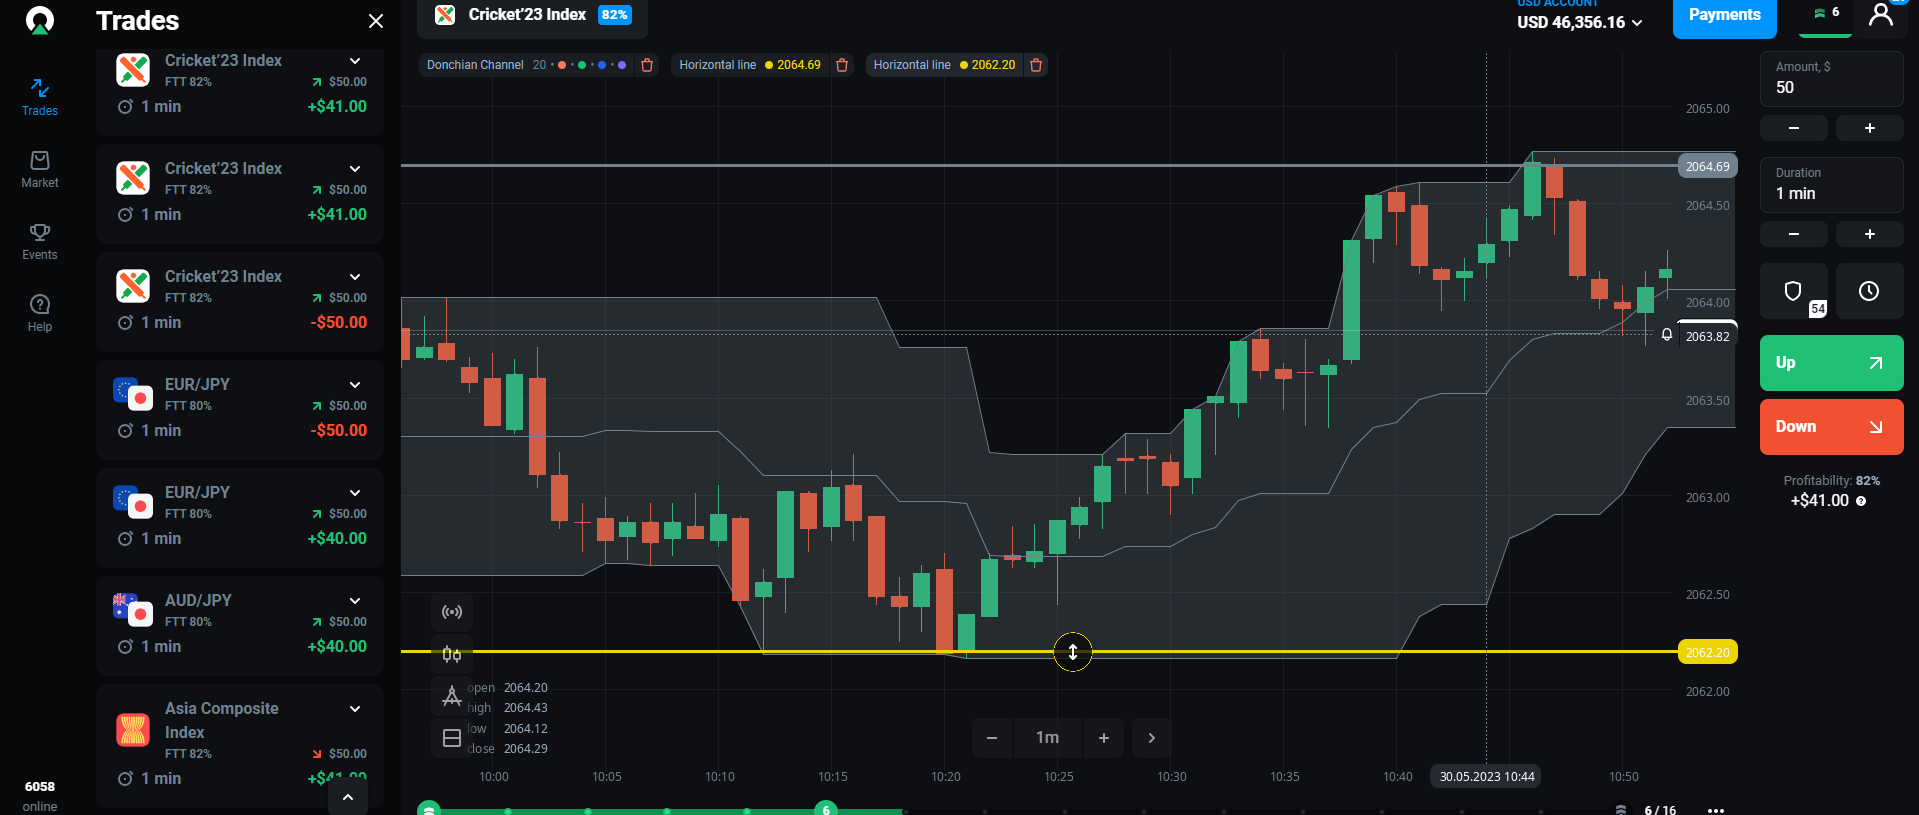
As you can see above is my live Olymp Trade trade account and I took about 7 trades using Donchian Channel Indicator out of 7 I got about 5 trades correct which is almost about 80% correct ratio. For better signals, I used Support and Resistance. You can also use Support and Resistance when you get a buy signal with the Donchian channel plus the price is near the support level it signals an upcoming bullish trend and vice versa when you get a sell signal with the Donchian channel plus the price is near the resistance level it signals an upcoming bearish trend. I will highly suggest you try this trading strategy on Olymp Trade for free click here to get started.