Signing up is free and takes 5 secs only..
SMA is one of the most effective indicators to find the current trend. If you have studied arithmetic you won’t find much issues in understanding the concept.
What is SMA?
A Simple Moving Average (SMA) is an arithmetic calculation by adding the closing price of the last few candles and then dividing that figure by the number of time periods in the calculation average. For example, you want to find the SMA of the last 10 candles you need to add the closing prices of the last 10 candles divided by 10 to get the current SMA.
The formula for SMA is,
SMA = C1 + C2 …..Cn / n,
Where,
An = The price of an asset at period n.
n = Total number of periods.
How to work with SMA 20 at Olymp Trade?
Firstly, You need to set the SMA 20 in Olymp Trade. So, log in to your account first.

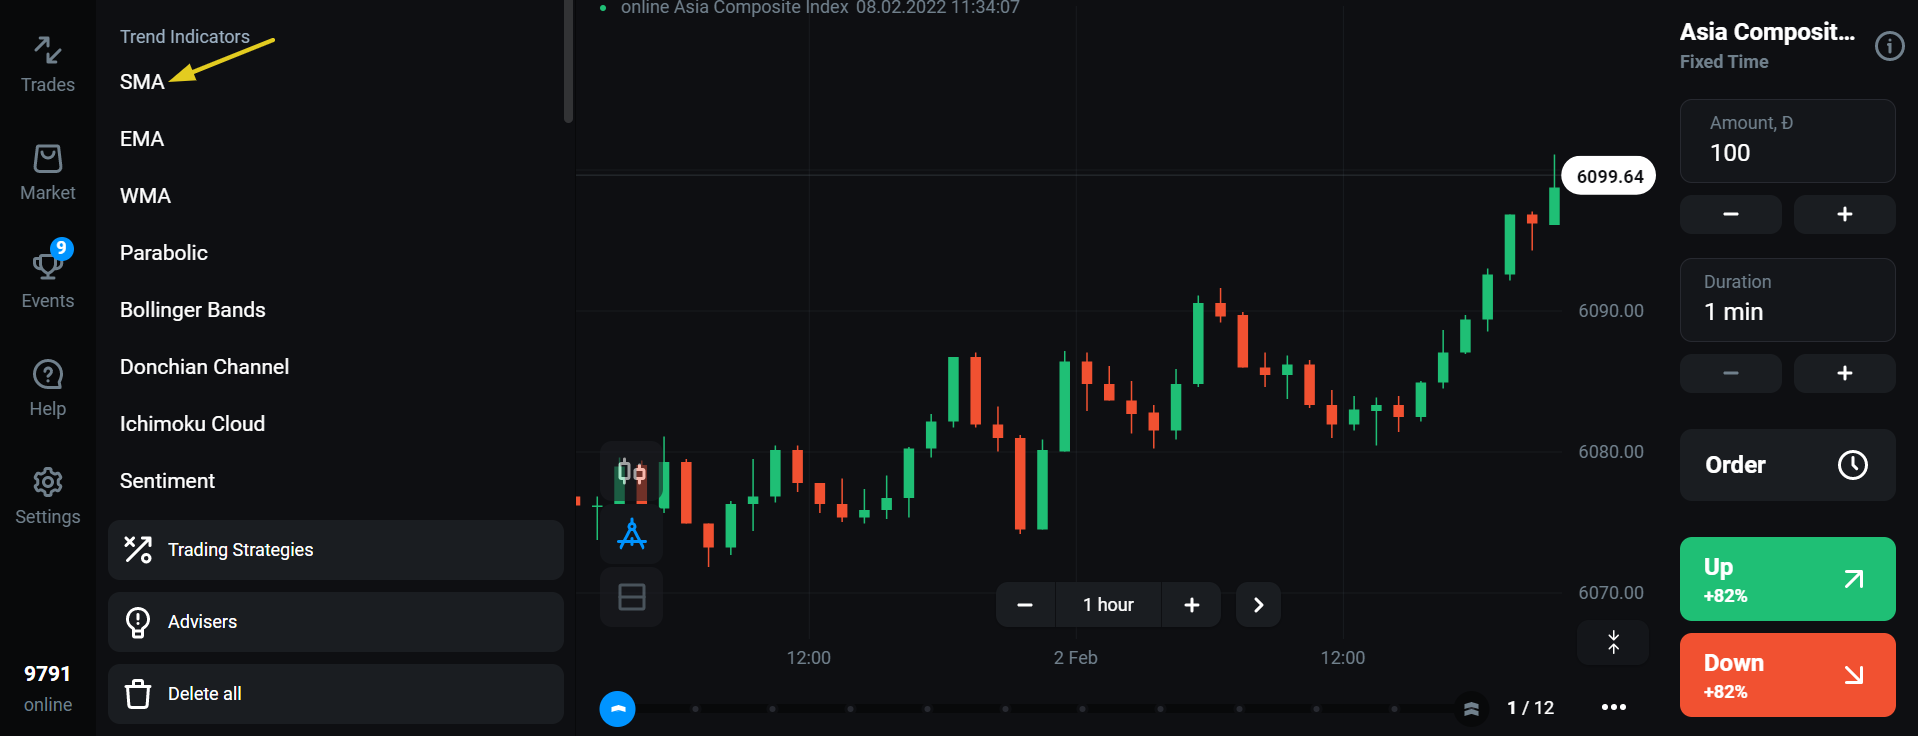
Secondly, click on the indicator button and select SMA from the menu.
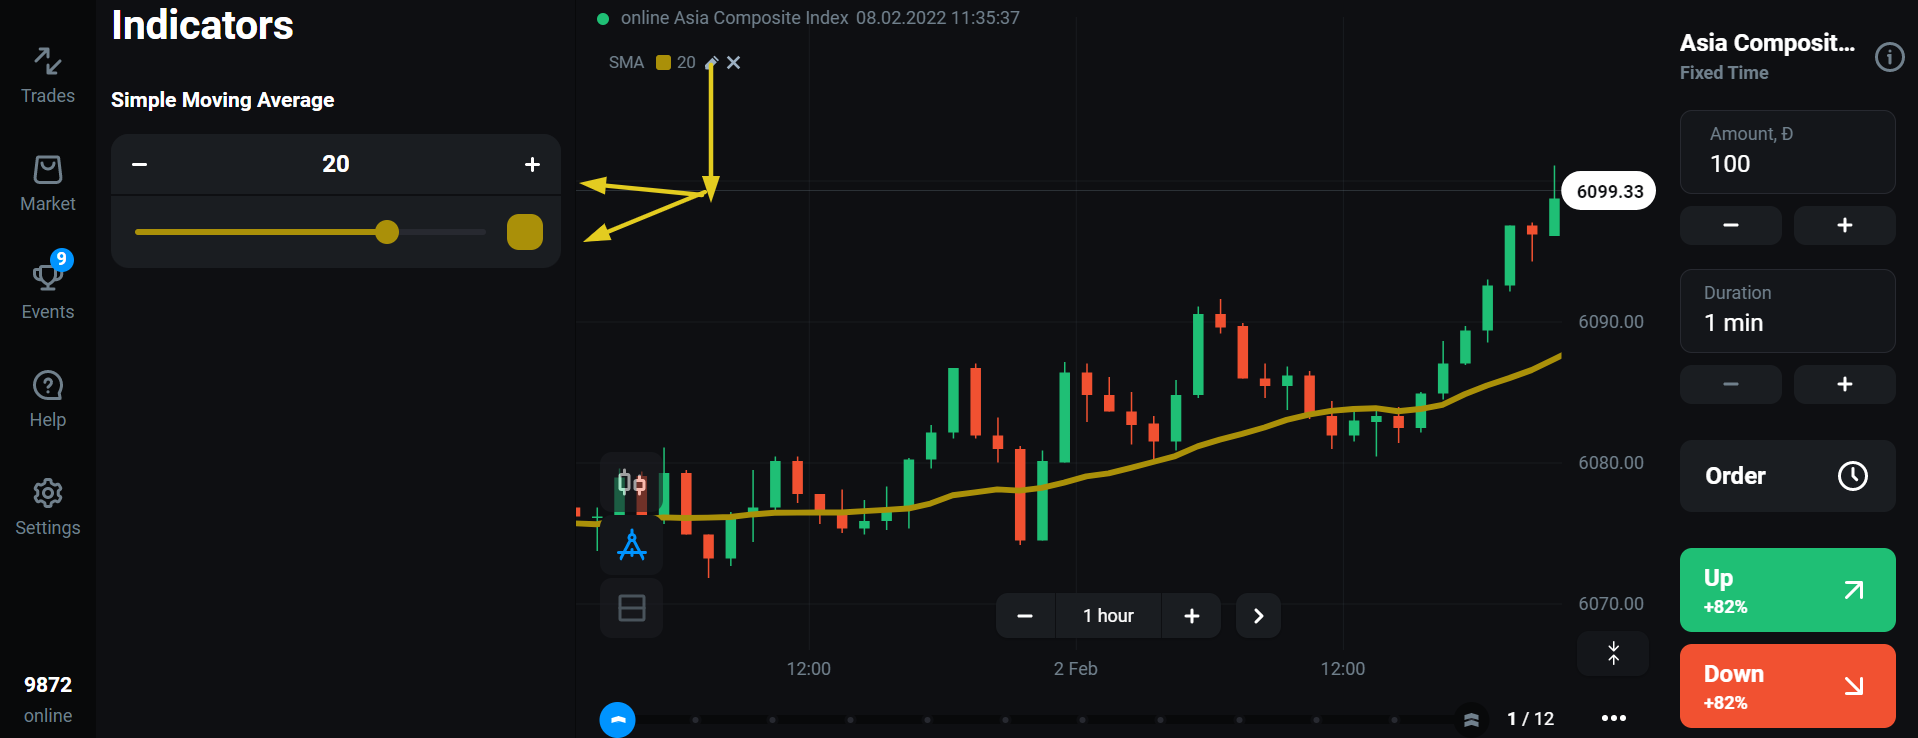
Now, set the indicator timer to 20. You can also change the colour and darken the line for better visibility.
How to Trade with SMA 20?
It’s really easy to identify the trend using SMA 20. You just need to focus on the intersection point between price and the indicator.
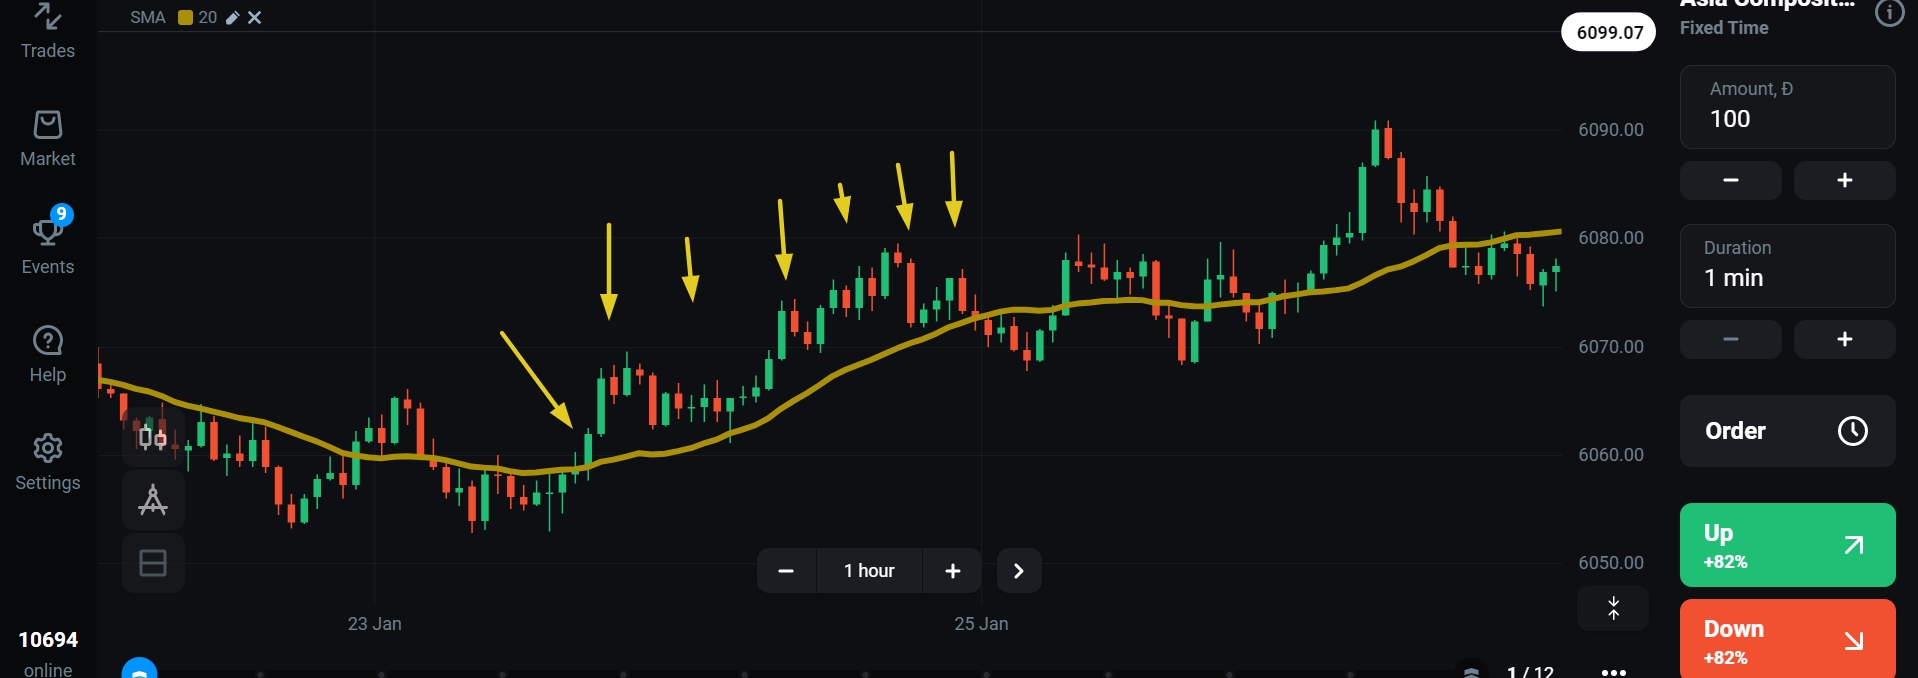
When the price and the moving average intersect each other and the price is above the indicator it signals a bullish trend and here we can make a buy trade.

Similarly, when the price intersects the moving average and the price is below the moving average it signals a bearish trend and here we can make a sell trade.
Is SMA 20 an effective Indicator?
SMA 20 is a good indicator and does give good signals while trading in a trending market. However, As I said earlier no indicator in this world is alone perfect. Therefore you should always use a trend confirmation like RSI to confirm your trade.
When the SMA 20 signals a bullish trend you need to check If the RSI line is near the oversold level then you can make a buy trade similarly, when the SMA 20 signals a bearish trend with the RSI line near the overbought level you can make a sell trade.
The best way to understand and analyse the indicator is by practising the same in the Olymp Trade demo account. So, I have covered everything about SMA 20 and I hope you have understood the concept. If you still have any issues do comment below and I wish you the very best of luck!!
