Signing up is free and takes 5 secs….
Fibonacci retracement or you can call it Fibonacci levels is one of the most popular technical tools that help traders to analyse market trends and reversals using a series of lines. In this, article I will explain you everything about Fibonacci retracement and how you can use the indicator to make big profits.
What is Fibonacci retracement?
Fibonacci retracement is one of the most powerful technical tools used by traders to identify potential trends and reversals of the security using a series of lines. This indicator was developed by the Italian mathematician Leonardo Fibonacci in the 13th century. However, he himself didn’t develop the Fibonacci numbers instead it was developed by an Indian mathematician Acharya Virahanka.
This tool is based on the Fibonacci sequence a series of numbers where each number is the sum of the two preceding numbers. The sequence starts with 0 and 1, and the next number is the sum of the previous two numbers, i.e., 0, 1, 1, 2, 3, 5, 8, 13, 21, 34, 55, 89, 144, and so on.
How to add Fibonacci Retracement on the Olymp trade chart?
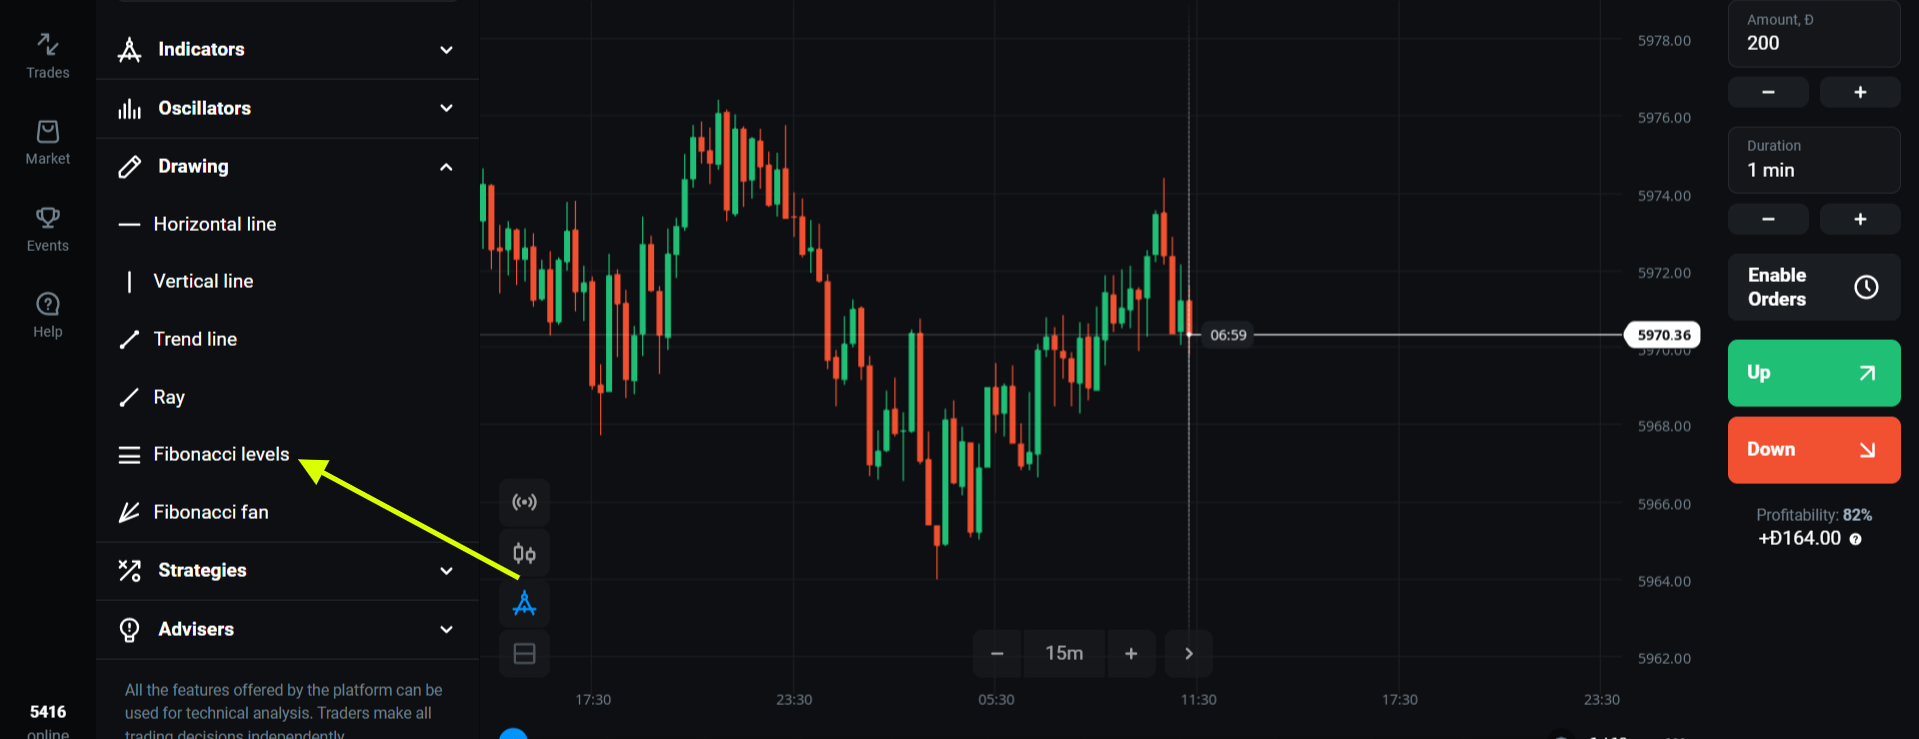
Firstly, log in to your Olymp Trade chart. Once you have logged in. click on the indicator button and search for the indicator name in the list. now, click the indicator name and configure the indicator as per your needs you can also increase the visibility by changing the style number and colour of the indicator line.
How to trade with Fibonacci Retracement on the Olymp trade?
Trading with Fibonacci lines is very easy. Firstly just stretch the Fibonacci lines below the lowest bottom of the candles. which will create automatic support and resistance lines for you.
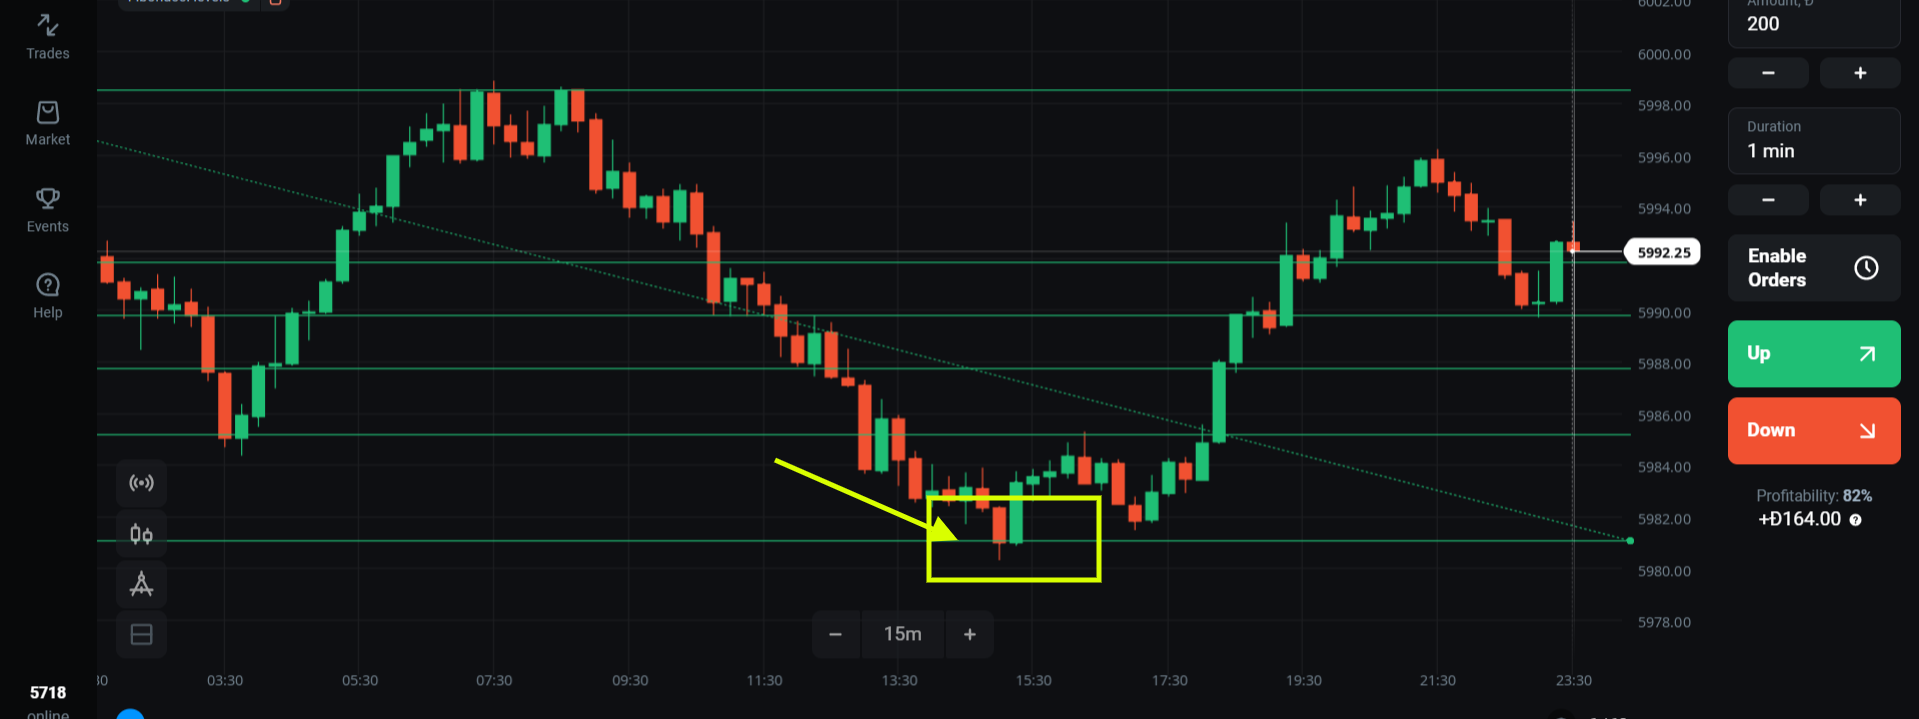

Given above is the 15 min chart and we can clearly see the price touching the lowest bottom or support level which signals an upcoming bullish trend and here we can place a buy trade for 10 – 15 minutes.
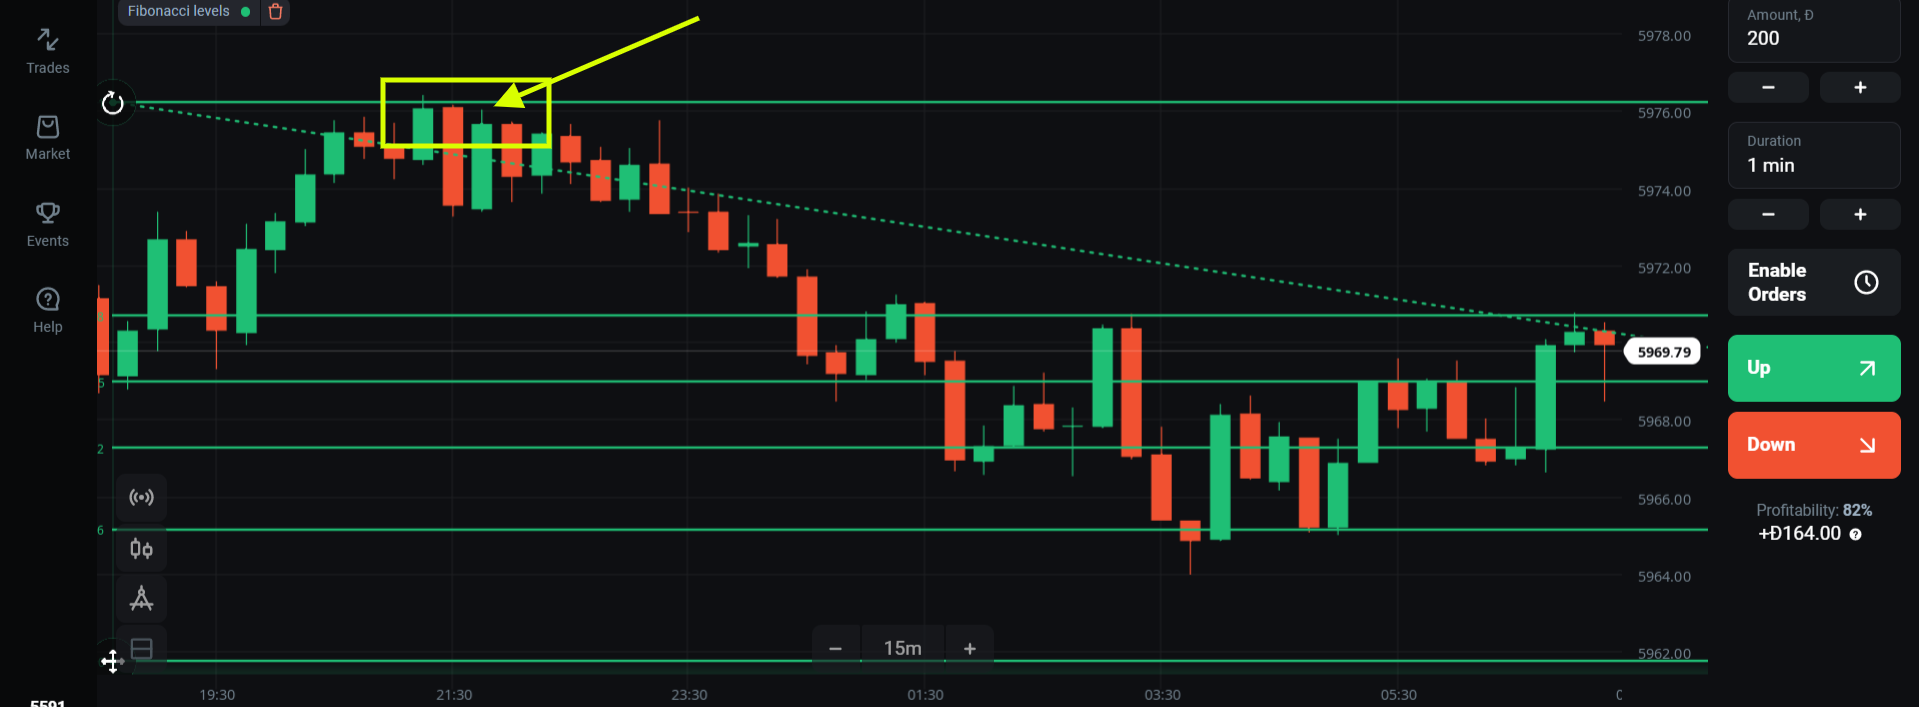
Similarly, given above is the 15 chart of the Asia Composite Index and we can clearly see the candle touching the highest top or resistance level so, here we can place a 15 mins sell trade.
Risk Management with Fibonacci Retracement
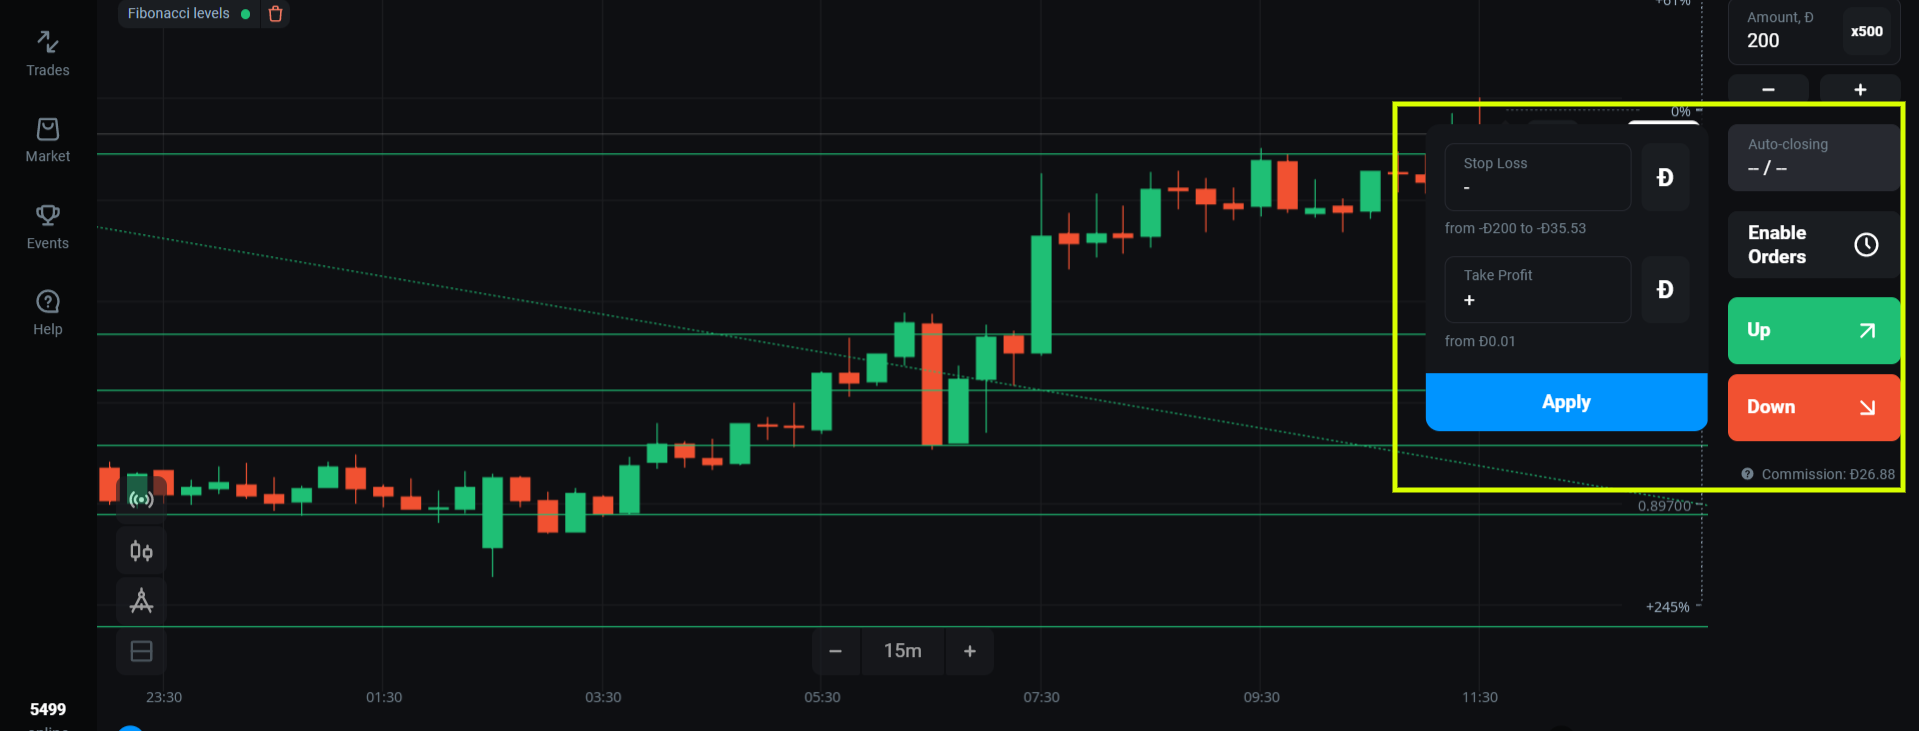
As I have said before no indicator is a foolproof and there is always a chance of facing certain losses. therefore you should always use a proper Risk Management to counter those losses. Risk management is an essential part of trading the best way to avoid loss is by using a stop-loss order.
For example, if a trader opens a buy trade at a potential level of support using the Fibonacci retracement, they can always place a stop-loss order below the support level to limit their losses if the price of the asset moves down against them.
Similarly, if a trader place a sell trade at a potential level of resistance using the Fibonacci retracement, they can always place a stop-loss order above the resistance level to limit their losses if the price of the asset moves up against them.
Try the above strategy for free on the Olymp Trade demo account. click here to try now.
