Signing up is free and takes 5 secs only….
What is CCI Indicator?
CCI indicator also known as the Commodity channel index is one of the most popular trading indicator used in technical analysis to identify the possible trends and reversals in the market. This indicator was developed by Donald Lambert in the 1980s. The indicator uses the difference between the current price and the historical price of the security. In this article, I will explore the CCI indicator and how it can be used on the Olymp Trade platform.
The formula for CCI Indicator is:
CCI = (Typical Price – n-period Simple Moving Average of Typical Price) / (0.015 x Mean Deviation)
Where:
Typical Price = (High + Low + Close) / 3
n = the number of periods used to calculate the moving average (usually set to 20)
Mean Deviation = the average of the absolute value of the difference between the Typical Price and the n-period Simple Moving Average of the Typical Price over the same number of periods
Adding CCI Indicator on the Olymp Trade chart
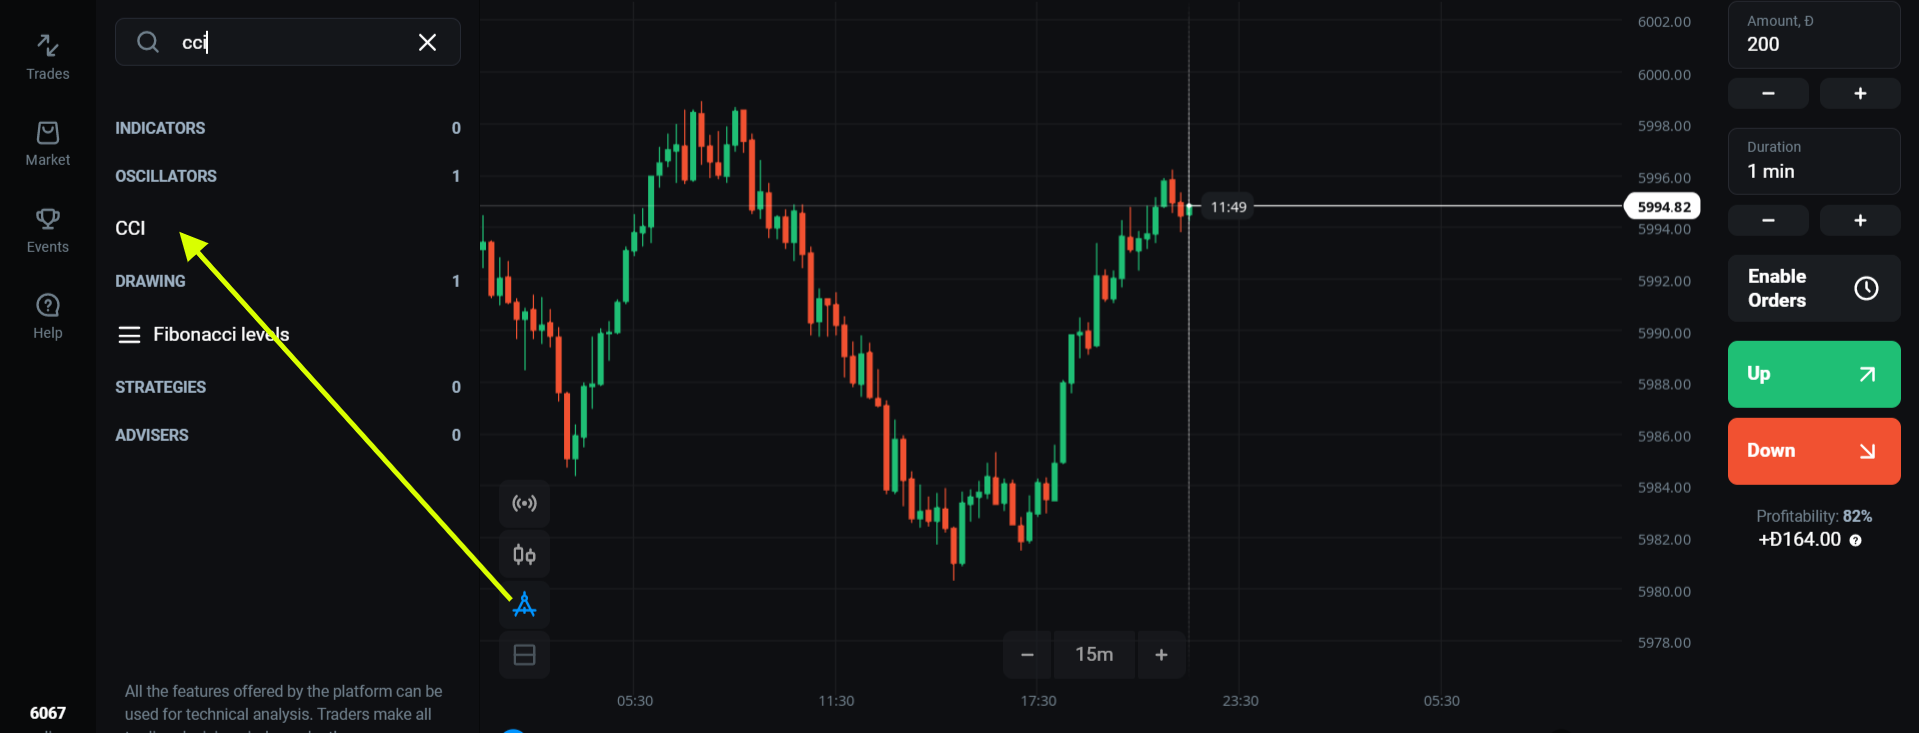
CCI Indicator is available on the Olymp trade platform and you can easily find the same in the trend section of the indicator list. To add the CCI indicator on the Olymp Trade chart follow the steps given below:
Log in to your Olymp Trade account and select the asset and set the default chart to the candlestick.
Click on the ‘Indicators’ button and search for the CCI Indicator in the list.

Select ‘CCI’ from the list of indicators and adjust the period and other settings based on your preferences.
Once you are done click apply and the indicator will be added to the chart.
How to Trade with CCI Indicator on Olymp Trade?
CCI indicator is a technical analysis tool via which you can analyse the market movement and predict the upcoming Trends and reversals
The typical period used for calculating the CCI indicator is 20 days but traders can adjust the period based on their preferences. the indicator is made from the composition of the three most important zones – 100, 100 and 0. A histogram line grows up or down around these three zones via which you can predict the upcoming trends and reversals.

When the Histogram line is above or near line 100. It signals an upcoming bullish trend and here you can consider placing a sell trade.

Similarly, When the Histogram line is above or near line 100. It signals an upcoming bullish trend and here you can consider placing a sell trade.
CCI indicator divergence
Divergence is the term used in technical analysis to describe a situation price where the price of an asset moves in the opposite direction to the technical indicator. The divergence occurs when the price of an asset moves in one direction while the indicator moves in the opposite direction. You can use this opportunity to place trades as it signals a potential change in the trend.
I will highly suggest you try this trading strategy on the Olymp Trade demo account. and once you are confident enough shift to Olymp Trade real account.
