Aroon Indicator is a technical analysis tool traders use to identify the price movements in securities. This Indicator is one of the most underrated trading tools developed by Tushar Chande in 1995, using this tool you can identify the upcoming trends and reversals with the help of two indicator lines.
Understanding Aroon Indicator
Aroon Indicator is a technical tool traders use to analyse the changes in the asset price and the trend’s strength. This indicator was developed by Tushar Chande in 1995, The name ‘Aroon’ is derived from the Sanskrit word ‘Arun’ which means ‘ dawn’s early light’. This indicator is made from the composition of two moving lines: the Aroon Up and the Aroon Down.
The Aroon Up line reflects the number of periods since the 25-period high while the Aroon down indicates the number of periods since 25 period low.
Aroon Up: [ ( 25 – Days since 25 period high ) /25 ] *100
Aroon Down: [ ( 25 – Days since 25 period low ) / 25 ] * 100

How to find and use the Aroon Indicator on the Pocket Option
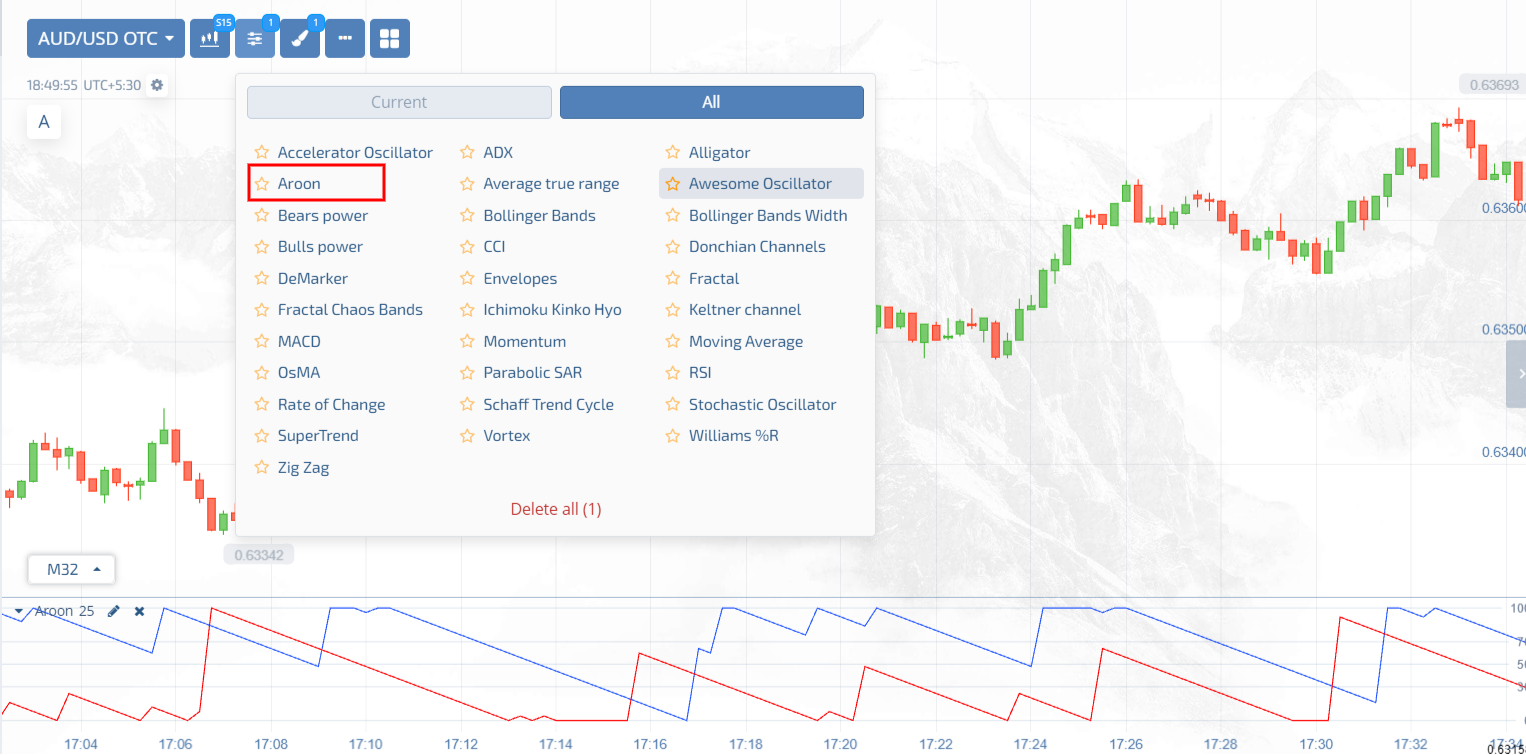
Aroon Indicator is a free-to-use technical analysis tool. You can even use this indicator on the Pocket option demo account. To get access to this trading tool you can create a new pocket option account using this link or login to the existing one. Once you have logged in you will get access to the Pocket Option trading dashboard now click on the indicator button and search for the Aroon Indicator in the list. lastly, Apply the necessary changes to the indicator and once you are done click apply.
Identifying trends using the Aroon Indicator on the Pocket Option

Crossover: You can easily identify the potential trends and reversals using the indicator crossover Aroon up and Aroon down lines with an upward crossover i.e. When Aroon up intersects above Aroon down is signals have a start of a potential up trend. and vice versa When Aroon up intersects below Aroon down it signals have a start of a potential down trend.
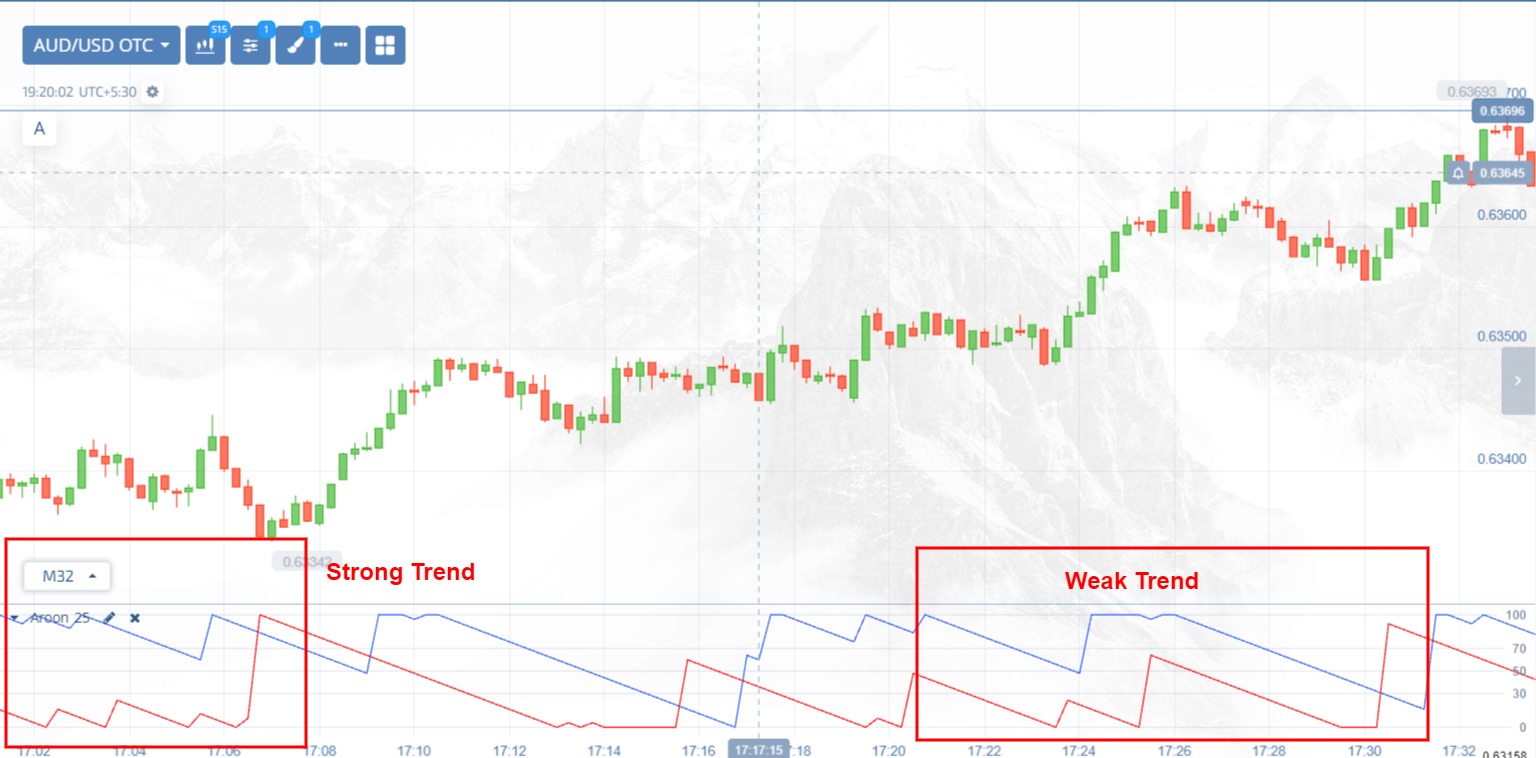
The distance between the Aroon up and Aroon down lines also indicates the strength of the trend a big gap between them signals a strong trend and vice versa the minimal distance between the two lines indicates a weak trend.
