What is a Stochastic RSI Indicator?
Stochastic RSI you can call it Stoch RSI is an indicator used in technical analysis that oscillates between 0 to 100. This indicator is made from the composition of the two most popular technical indicators Stochastic Oscillator plus the Relative Strength Index.
This indicator was developed to help you find the most accurate trading signals. you can easily use this indicator on the Olymp Trade platform and find the potential trends and reversals to determine the perfect entry and exit points.
The Stochastic RSI is calculated by taking the RSI value and applying the Stochastic Oscillator formula to it. This indicator is a momentum indicator that helps traders to identify the potential trend and reversals using the Overbought and Oversold levels.
How does Stochastic RSI Indicator work?
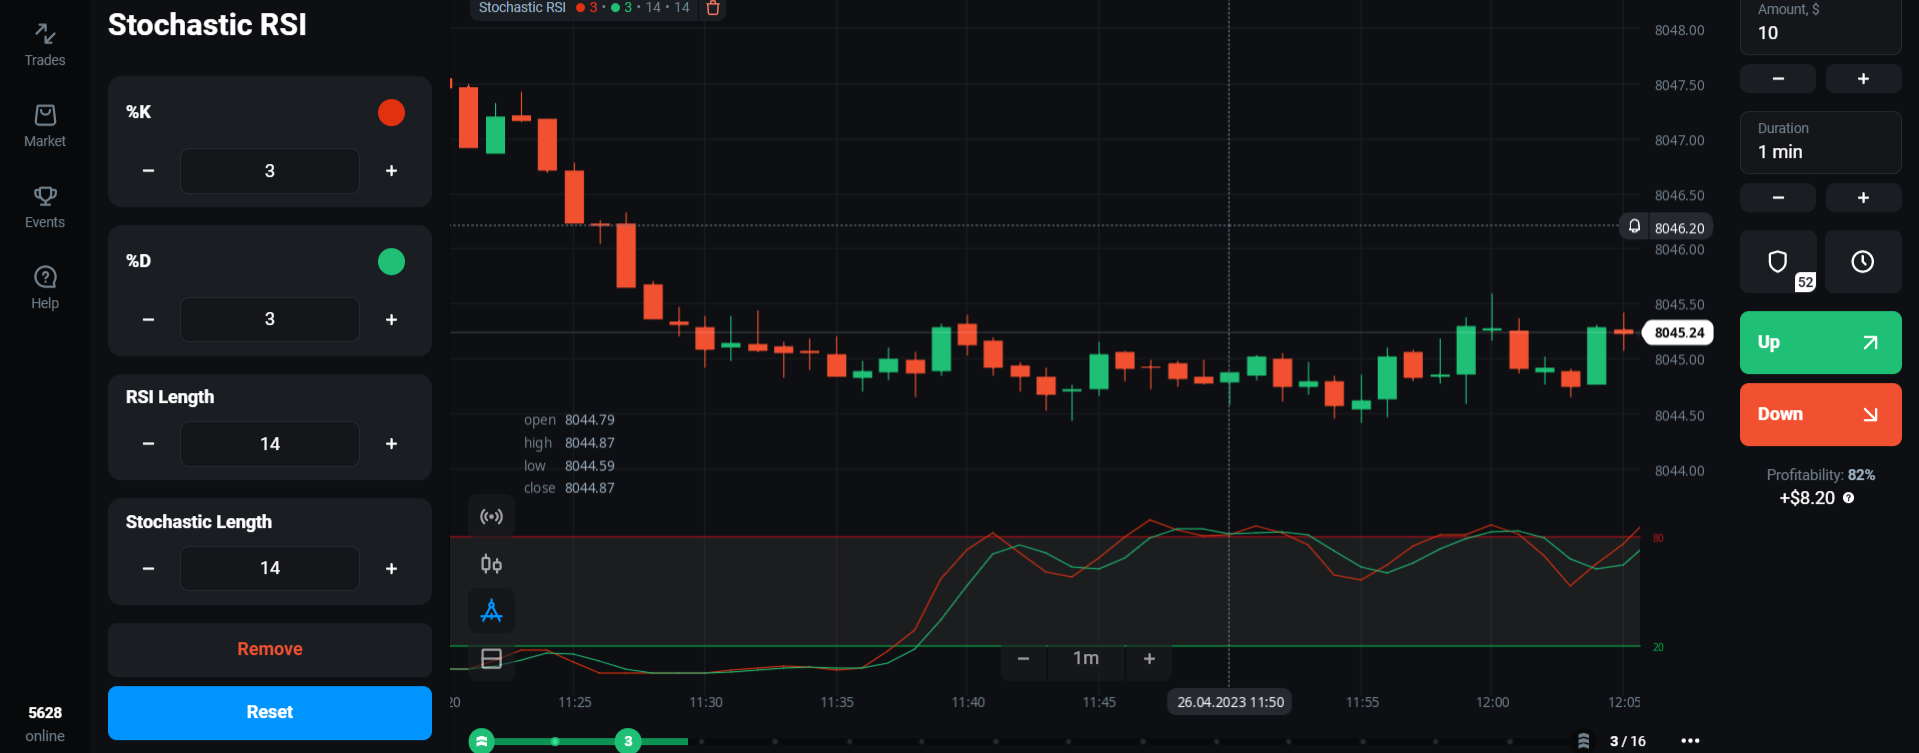
The Stochastic RSI indicator is made from the four most important components i.e. %K line, % D line, RSI length and Stochastic length. The %K line and % D line oscillates between line 20 and 80. when the two lines are above line 80 it signals an upcoming bearish trend vice versa when the two lines are below line 20 it signals an upcoming bullish trend.
In order to calculate, Stochastic RSI you need to calculate the RSI value following the Stochastic oscillator and next combine the Stochastic Oscillator formula with the RSI value
The formula for Stochastic RSI is:
StochRSI = (Current RSI – Lowest RSI) / (Highest RSI – Lowest RSI)
Where:
Current RSI = Most recent RSI value
Lowest RSI = Lowest RSI value over the chosen period
Highest RSI = Highest RSI value over the chosen period
Note: The StochRSI value ranges from 0 to 1.

How to add Stochastic RSI on the Olymp Trade chart?
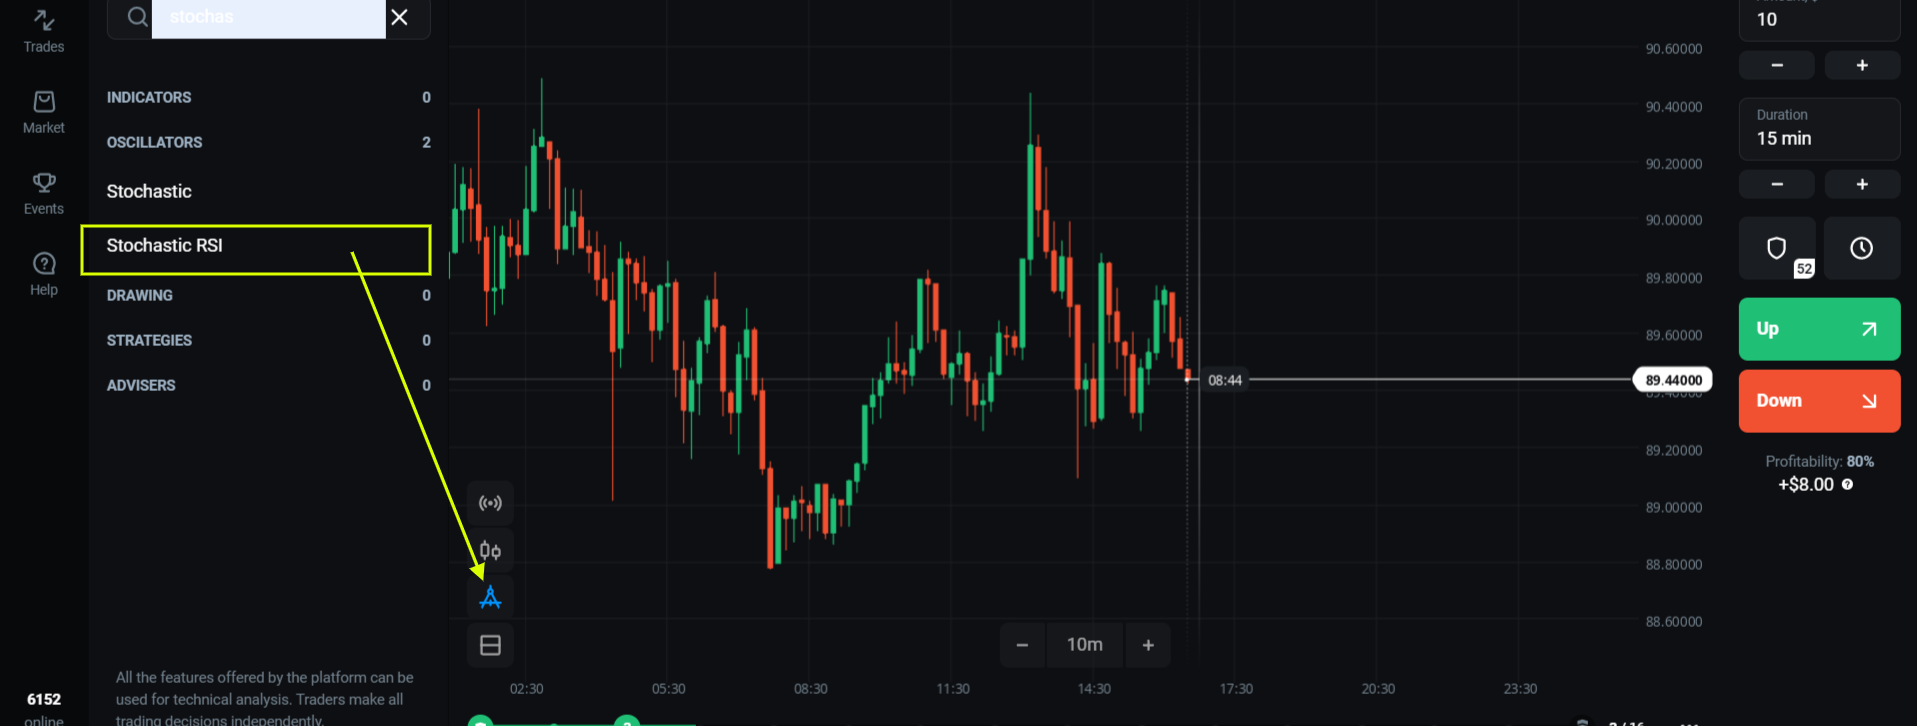
In order, to add the Stochastic RSI indicator on Olymp Trade chart. Firstly, login to your Olymp Trade account. In case, you are not a member of the Olymp trade sign up here. you will get $10, 000 virtual currency on your demo account plus up to 100% welcome bonus. Once you have logged in click on the indicator button and search and select the name Stochastic RSI from the menu. Now, configure the indicator as per your requirement. You can even change the period of the indicator if you want. However, the default setting is ideal for an Intraday trader and you can easily place 10 -15-minute trades using the same.
Buy with an Oversold level
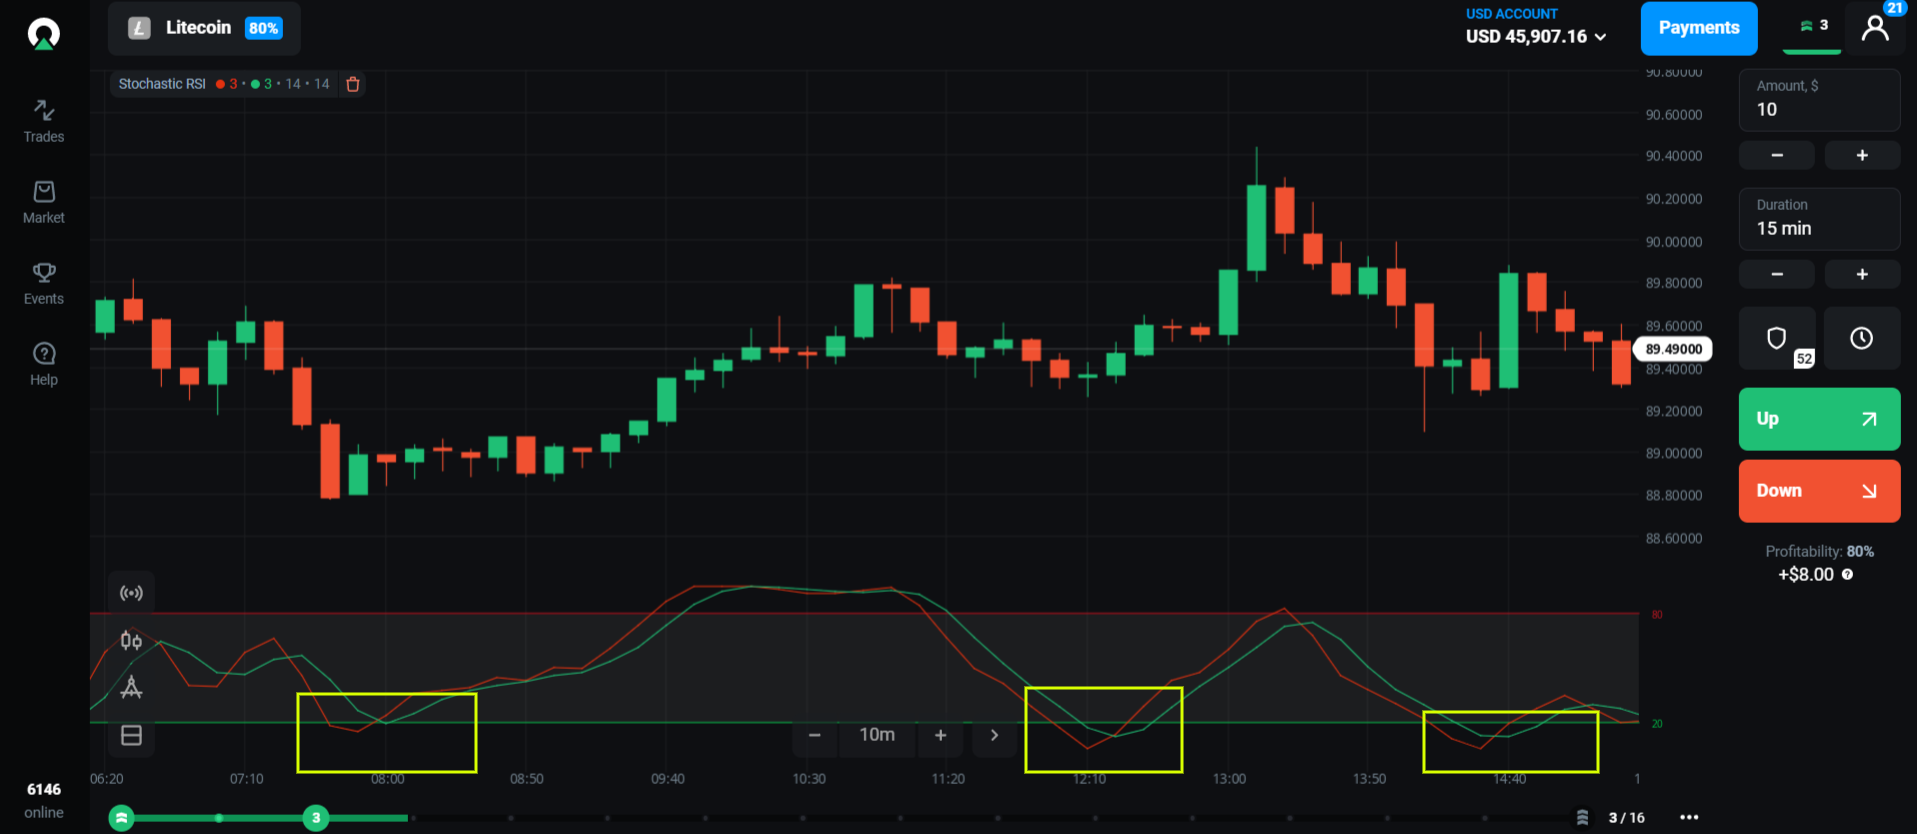
When the moving average line of the Stochastic RSI indicator is below line 20. It signals an upcoming bullish trend and here you can consider placing a buy trade.
Given, above is the 10-minute chart of Litecoin, and we can clearly the moving average line of the indicator below the line 20 (Oversold level). It signals an upcoming bullish trend and here, we can place a buy trade for 10 min – 15 mins.
Sell with an Overbought level
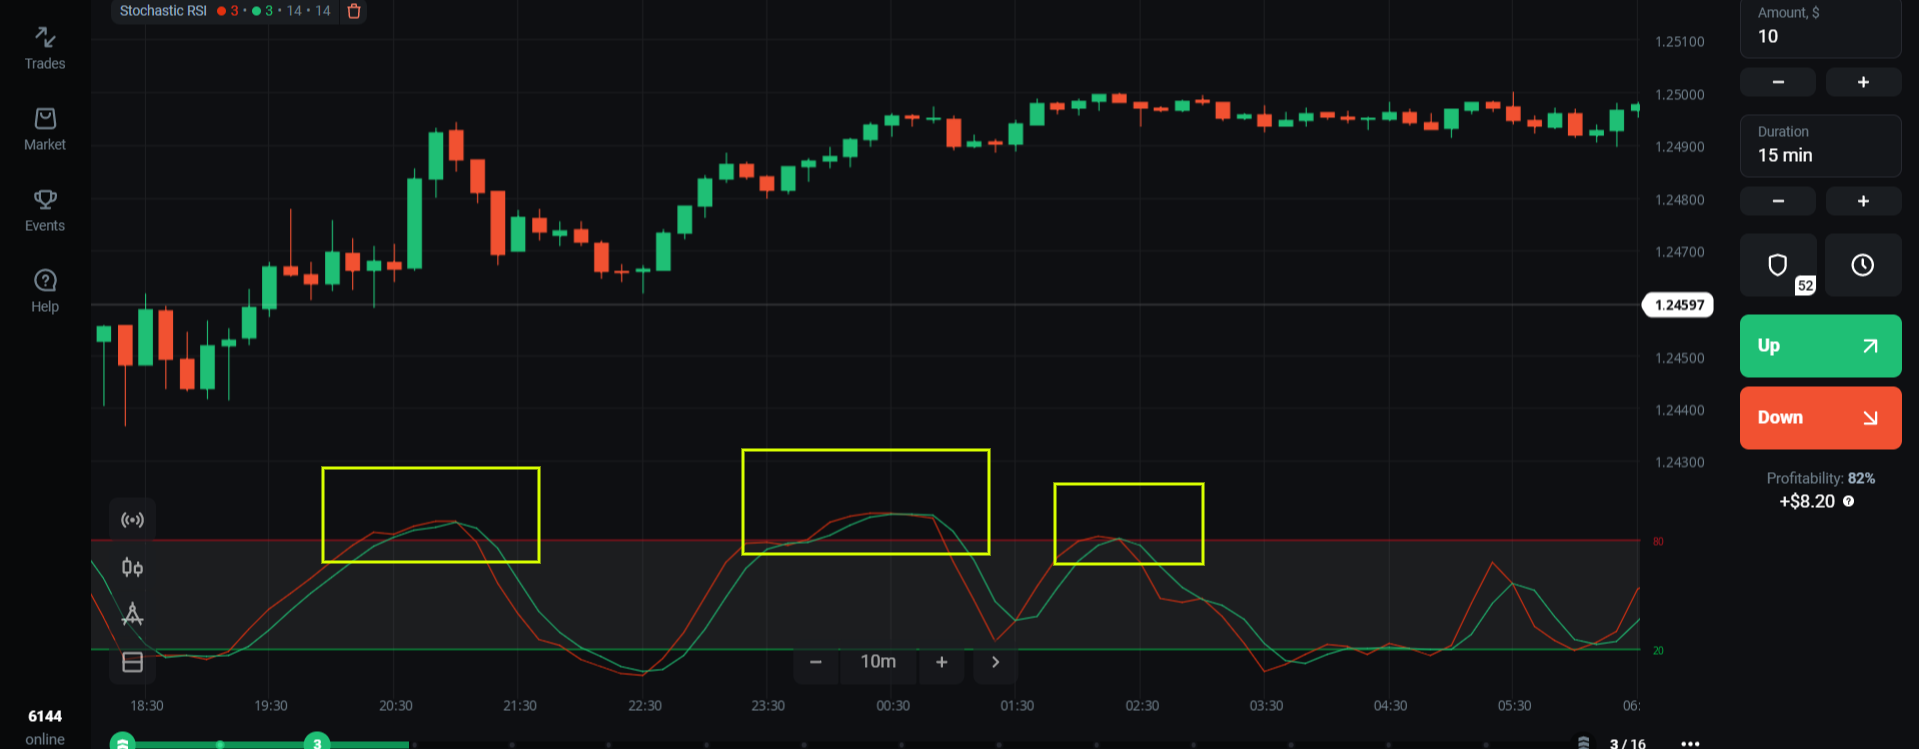
Similarly, When the moving average of the Stochastic RSI indicator is above line 80. It signals an upcoming bearish trend and here, we can consider placing a sell trade.
Given above is the 10-minute chart of GBP USD and we can clearly see the moving average line of the indicator above line 80 (Overbought level). It signals an upcoming bearish trend and here, we can place a sell trade for 10 min – 15 mins.
Try the above indicator on the Olymp Trade demo account. Sign up using this link and get $10, 000 in your demo account with up to 100% welcome bonus.
I wish you the very best of luck 🙂
