A line chart also known as an Area chart is the easiest way to understand the movement of the security. you can easily understand the asset or security movement using this chart. In this article, I will cover everything about this chart and how you can trade with the same.
What is an Area chart?

- The Area chart is a graphical representation of a security price action connected with the data points and a continuous line.
- A line chart displays the security closing price. whereas, In the bar chart, you will see the opening and closing price of the security.
- The line chart is the easiest chart and can be even used by beginners as the traders just have to focus on the changes in the closing price of the asset.
How to find and set the Line chart on Olymp Trade
To set the Line chart on Olymp Trade. follow the steps below.
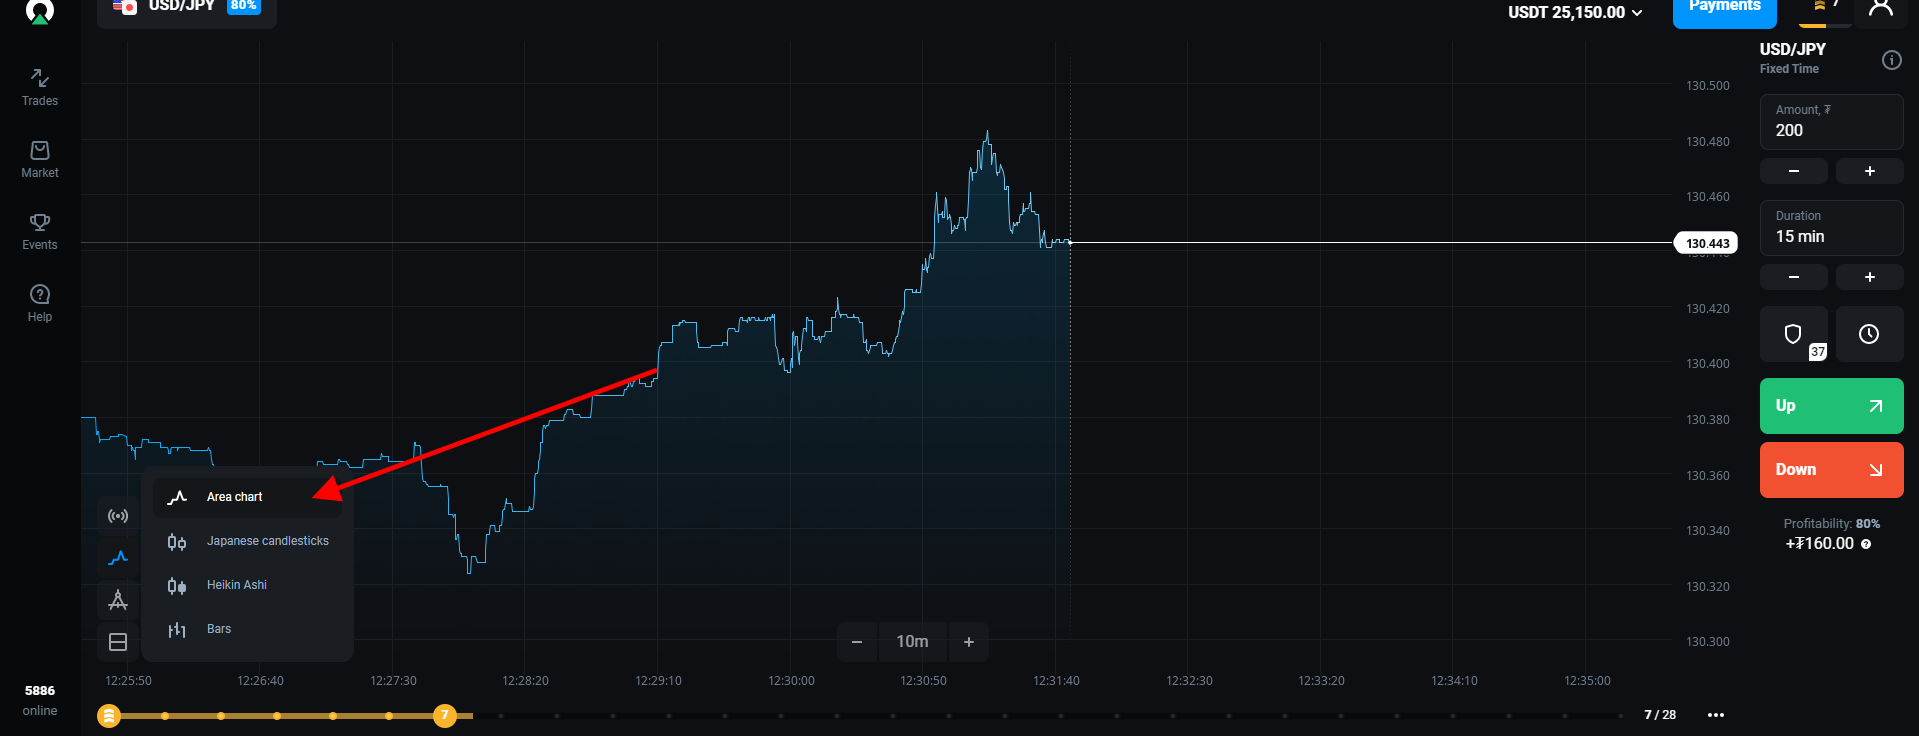
Login to your Olymp Trade account => click the chart button => select Area chart from the menu
How to trade with Area chart on Olymp Trade
Trading with an Area chart is pretty simple and easy. the best way to trade with this chart is by combining it with Support and resistance. In case you don’t know how to draw the Support and Resistance lines on the Olymp trade click here.
Now, In order to Support and Resistance using the Area chart. Follow the steps below:-
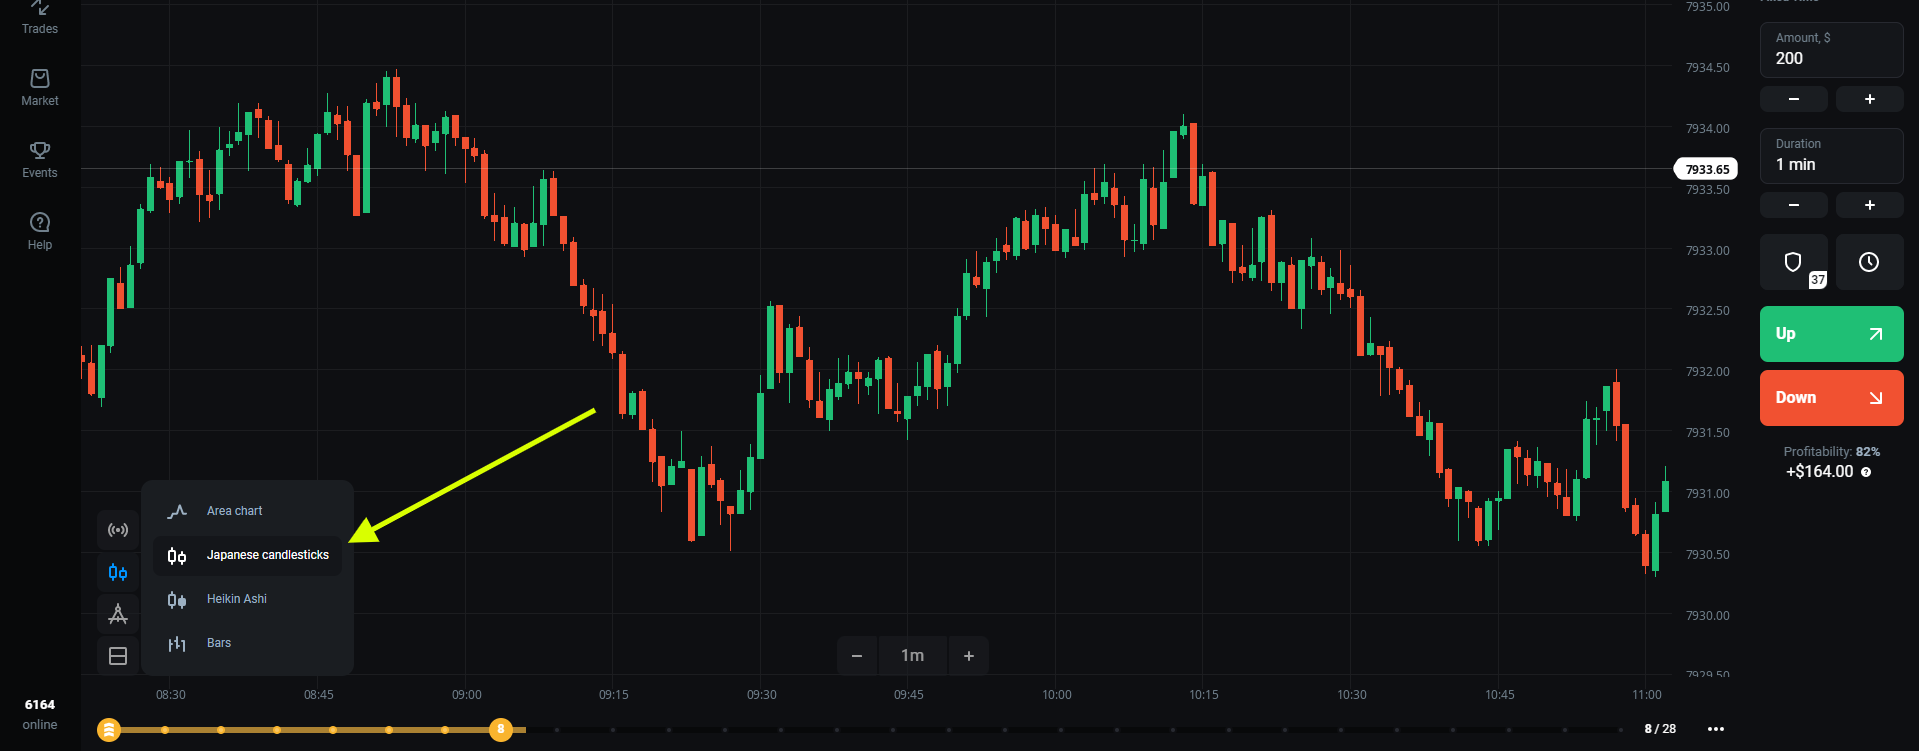
Step 1 – Set your default chart to the candlestick.

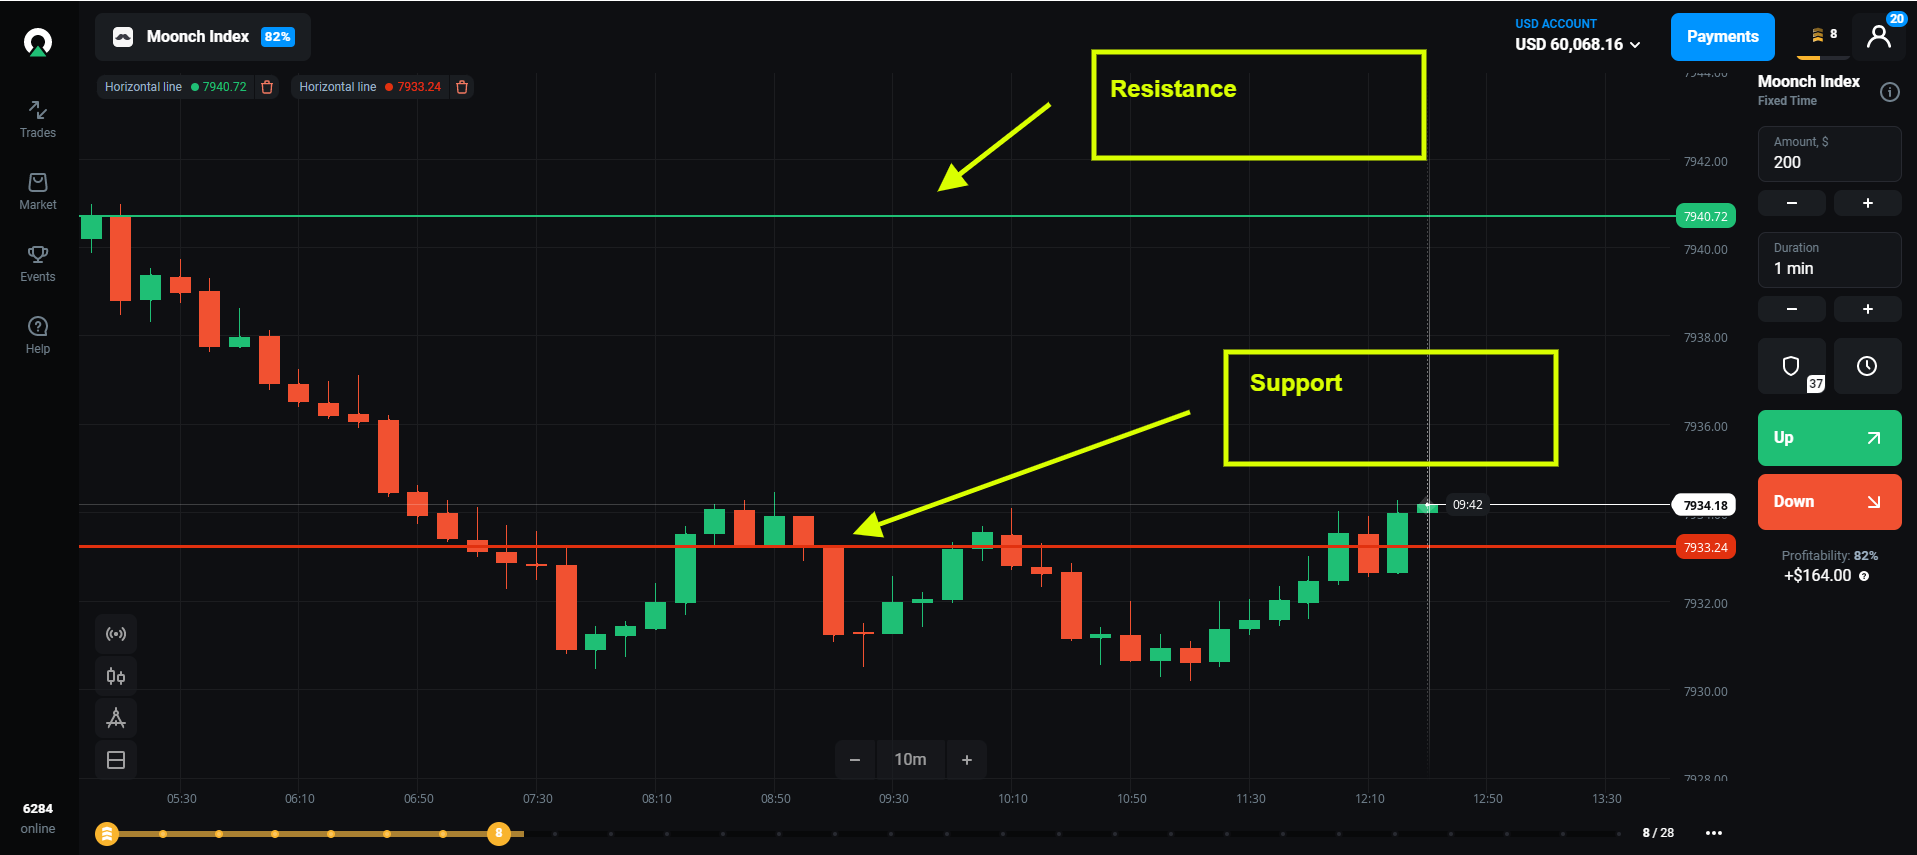
Step 2 – Draw a horizontal line and place the line near two lows for the support level and vice versa near two highs for the resistance level.
Step 3 – Lastly, change your default chart to a line chart again.
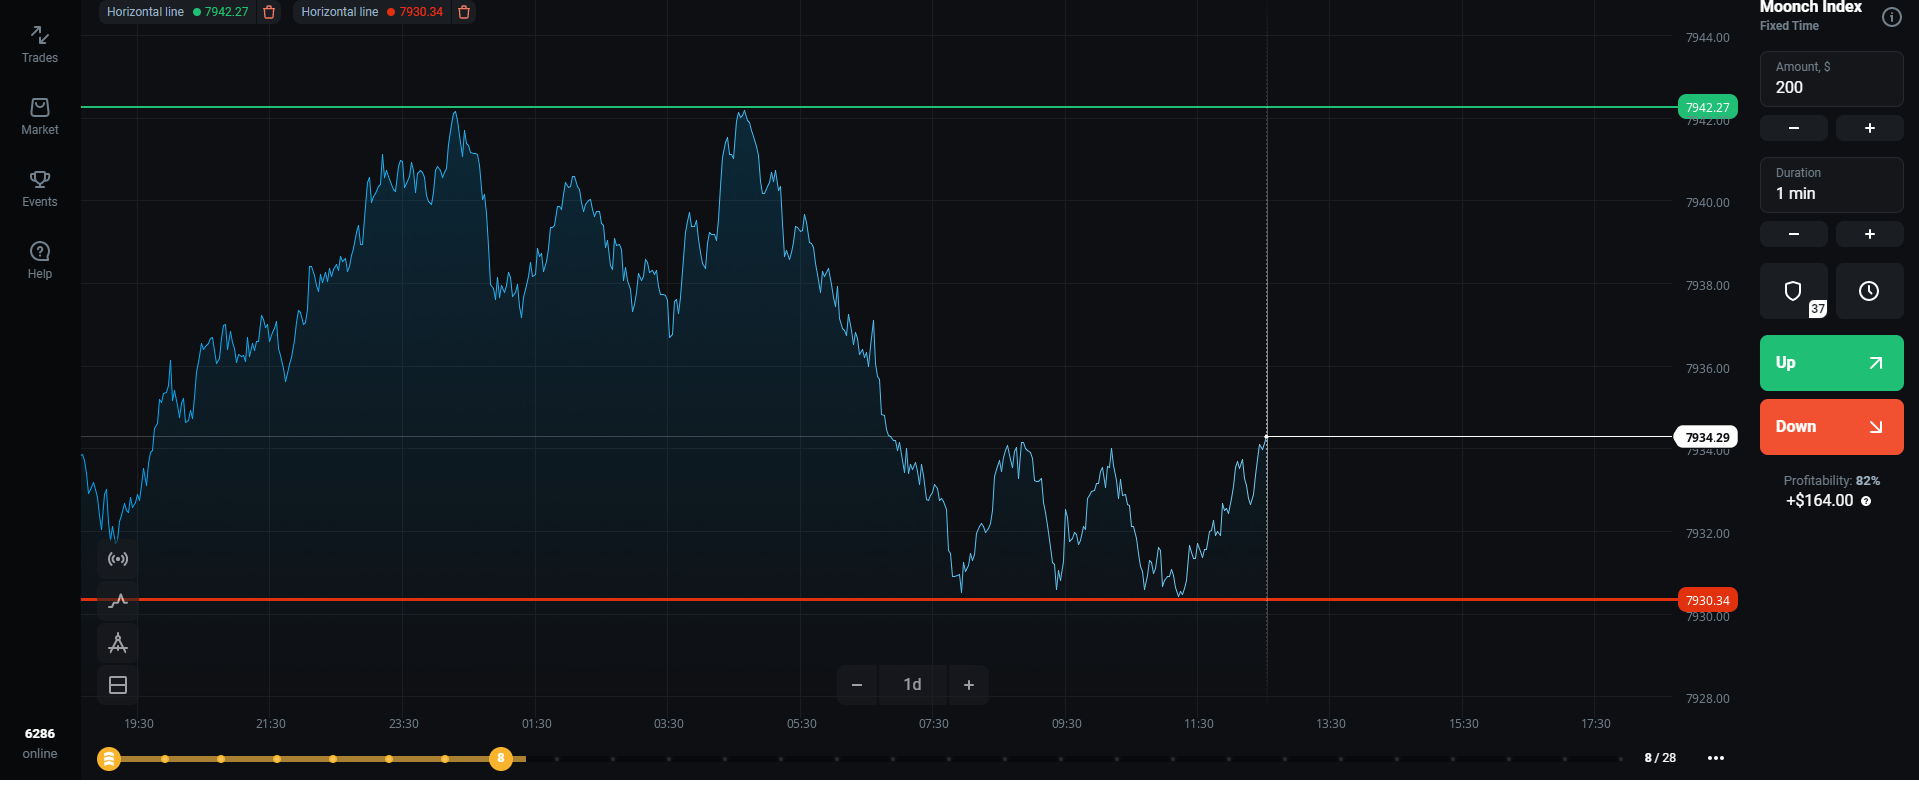
Buy near the Support level

When the closing price of the security or Area line is near the support level it signals an upcoming bullish trend and here, you can place a buy trade.
Sell near the Resistance level

Similarly, when the security closing price or Area line is near the resistance level it signals an upcoming bearish trend and here we can place a sell trade.
So, this is how you can trade with a Line chart or Area chart on Olymp trade. the best thing you can do is try this chart on Olymp Trade demo account where you will get $10, 000 virtual chips and you can use them to learn and trade accordingly.
I wish you the very best of luck 😉
