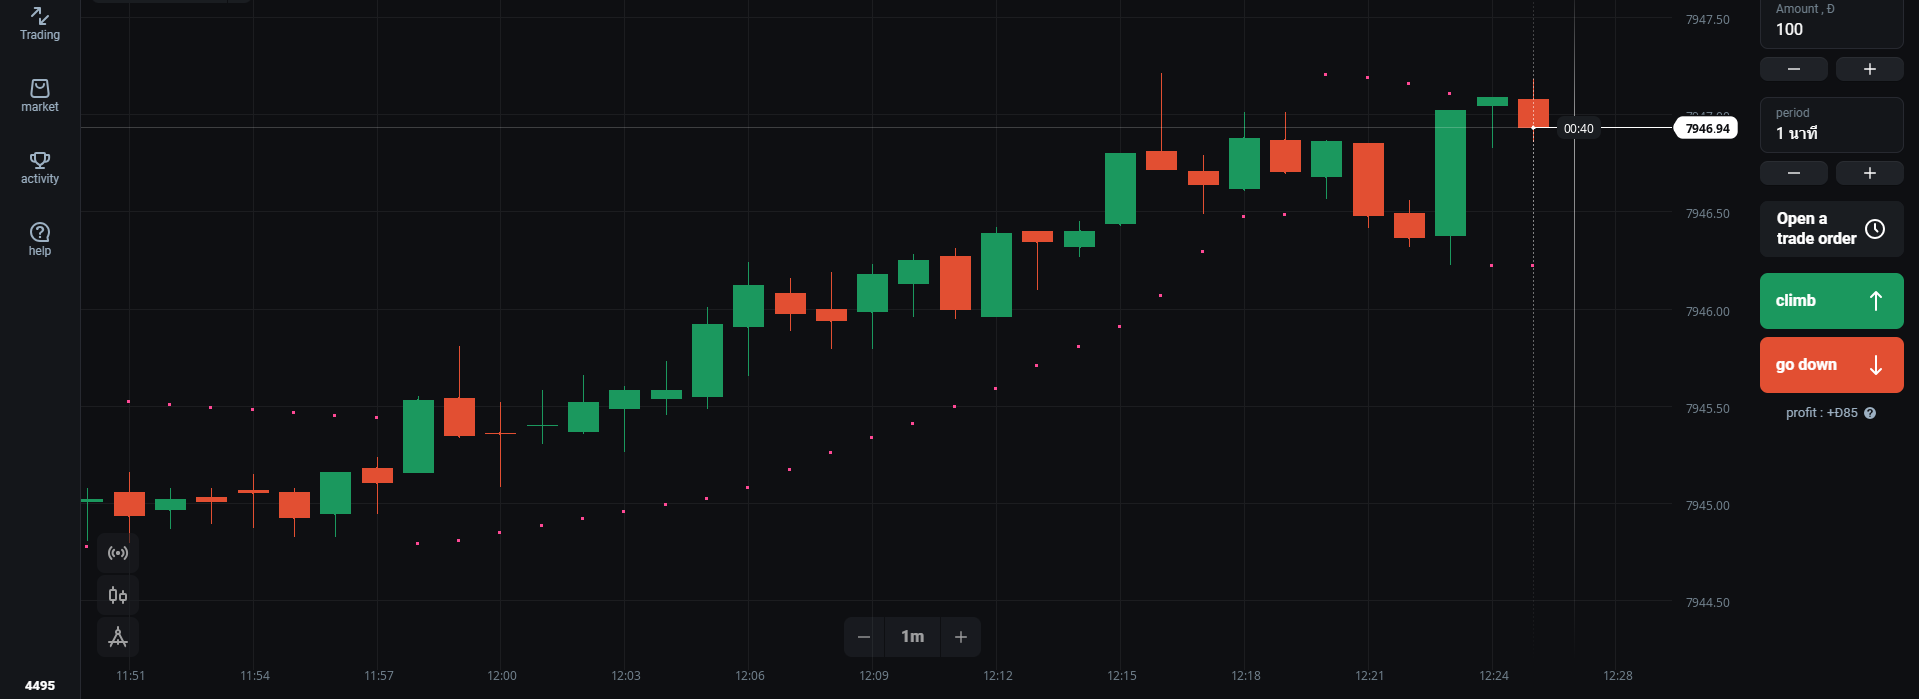
Trading effectively on Olymp Trade involves leveraging technical indicators to make informed decisions. Choosing a high-quality trading indicator can seriously impact your trading results as these indicators help traders analyse the market trends and identify the potential entry and exit points.
In this article, I will share my favourite Top 5 best indicators for Olymp trade that can significantly improve your trading results and can help you become a pro trader.
Suggested Read: Activate Olymp Trade upto 100% Bonus Promo Code
How to add Indicator on the Olymp Trade platform

Olymp Trade is a beginner-friendly trading platform therefore, You can even use the listed below indicators on the Olymp Trade demo account for free.
In order to add an indicator, You first need an access to the Olymp Trade demo account. In case, You don’t have an Olymp Trade account yet click here.
Next, set your default chart as candlestick and select your desired currency. Lastly, click the indicator button at the top of the page and search for the indicators in the list.
5> Parabolic SAR
Parabolic SAR or you can call it Parabolic stop and reverse is a very unique indicator made from a series of dots that oscillates around the price above or below.
With the dots above the price signal an upcoming bearish trend and vice versa with dots below the price signal an upcoming bullish trend. This indicator was developed by J. Welles Wilder who has also created the Relative strength index.
Key features
- The Parabolic SAR is represented by a series of dots that ribbons around the price either above or below the same.
- When the dots are below the price it signals an upcoming bullish trend and vice versa when dots are above the price it signals an upcoming bearish trend
- You can even identify the strength of the trend with the distance between the price and the dots. A big distance between the price and the dots represents a strong trend and vice versa with a distance lesser between the price and the dots represents a weak trend.
Suggested Read: Here’s How You Can Maximize Your Profit with Parabolic SAR on Olymp Trade
4> Relative Strength Index or RSI
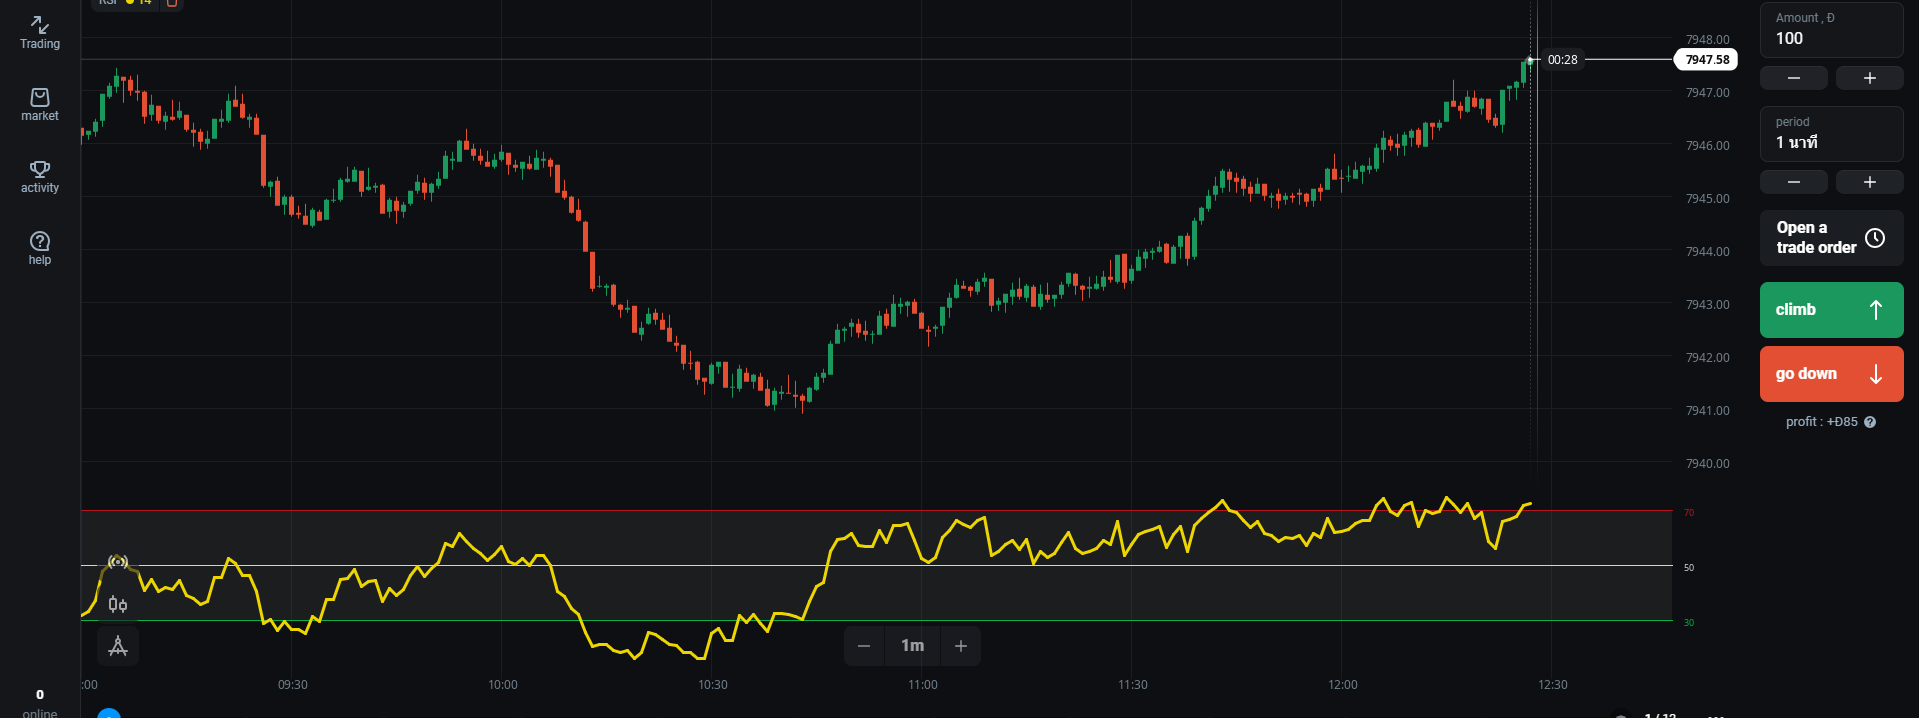
RSI or Relative Strength Index is a momentum oscillator used in technical analysis to identify upcoming trends and reversals using a single moving average line.
The moving average line oscillates around the overbought and oversold levels via which you identify the upcoming trends and reversals. With the moving average line above or near line 70 signals an upcoming bearish trend and vice versa with the moving average line below or near line 30 signals an upcoming bullish trend.
Key features
- RSI or Relative Strength Index is a Momentum oscillator used in trading to identify upcoming trends and reversals.
- This indicator is made from a single moving average line that oscillates around the overbought and oversold levels.
Suggested Read: Tutorial on using RSI ( Relative Strength Index ) at Olymp Trade
3> Support and Resistance
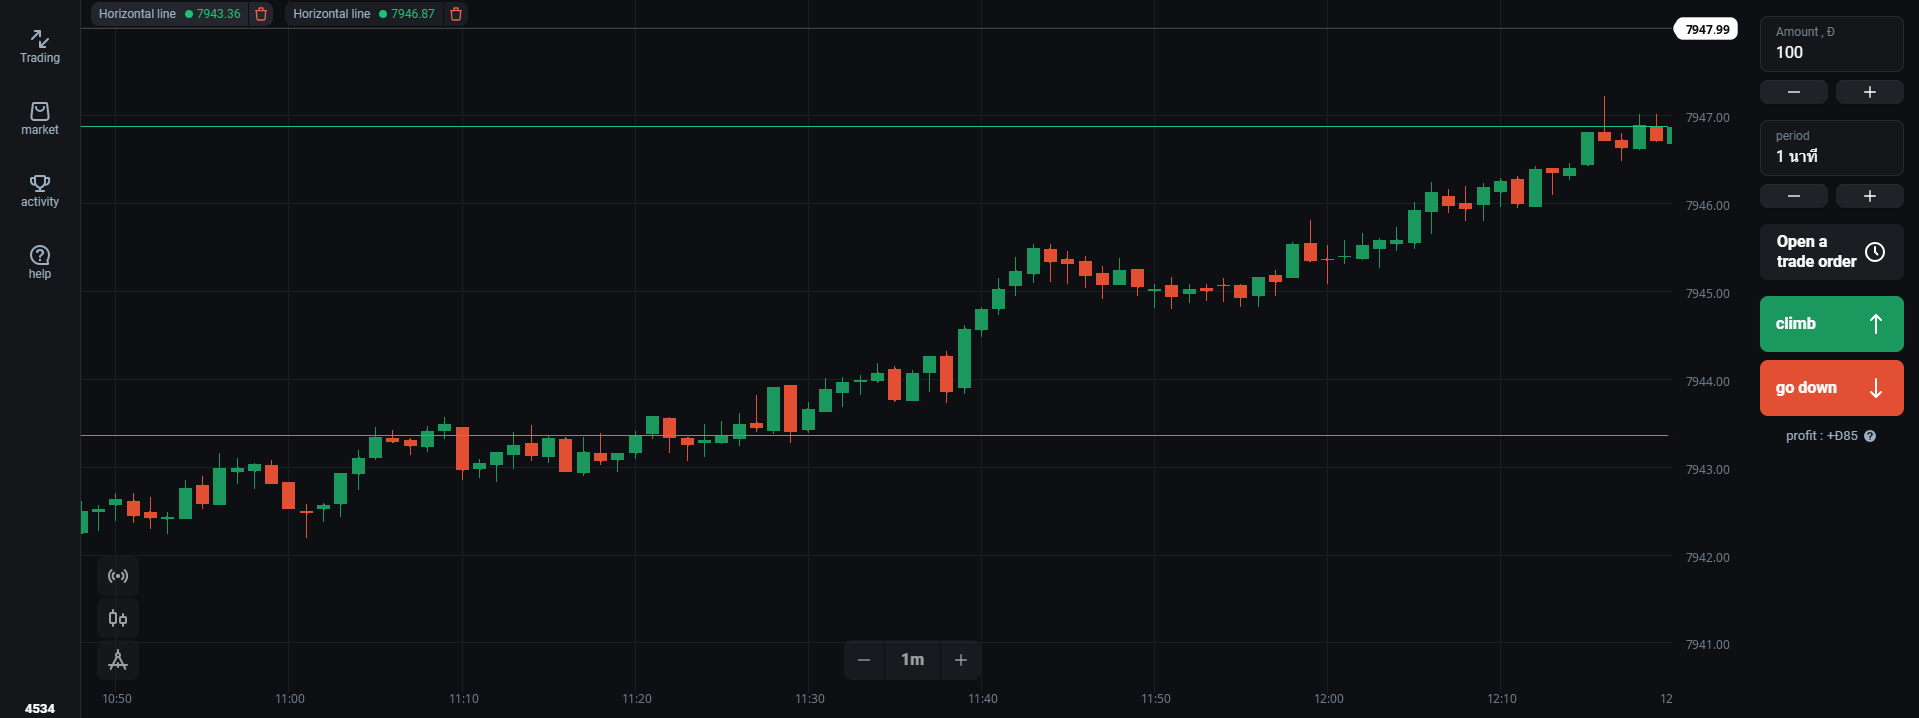

Support and Resistance are not really an indicator they are the manually drawn price levels placed with the help of Horizontal lines. These two price levels act as the barrier for the prices as the Support level stops the price from going down continuously and vice versa, The Resistance level stops the price from going up continuously.
Key Features
1> Support is the price level which acts as a barrier to the price and stops the price from going down continuously.
2> Resistance is the price level which act as a barrier to the price and stop the price from going up continuously.
3> If due to any market uncertainty, the price breaks these two levels it is presumed that the price will continue its momentum until the next support or resistance levels.
Read: Master the art of drawing Support and Resistance on Olymp Trade
2> Bollinger Bands
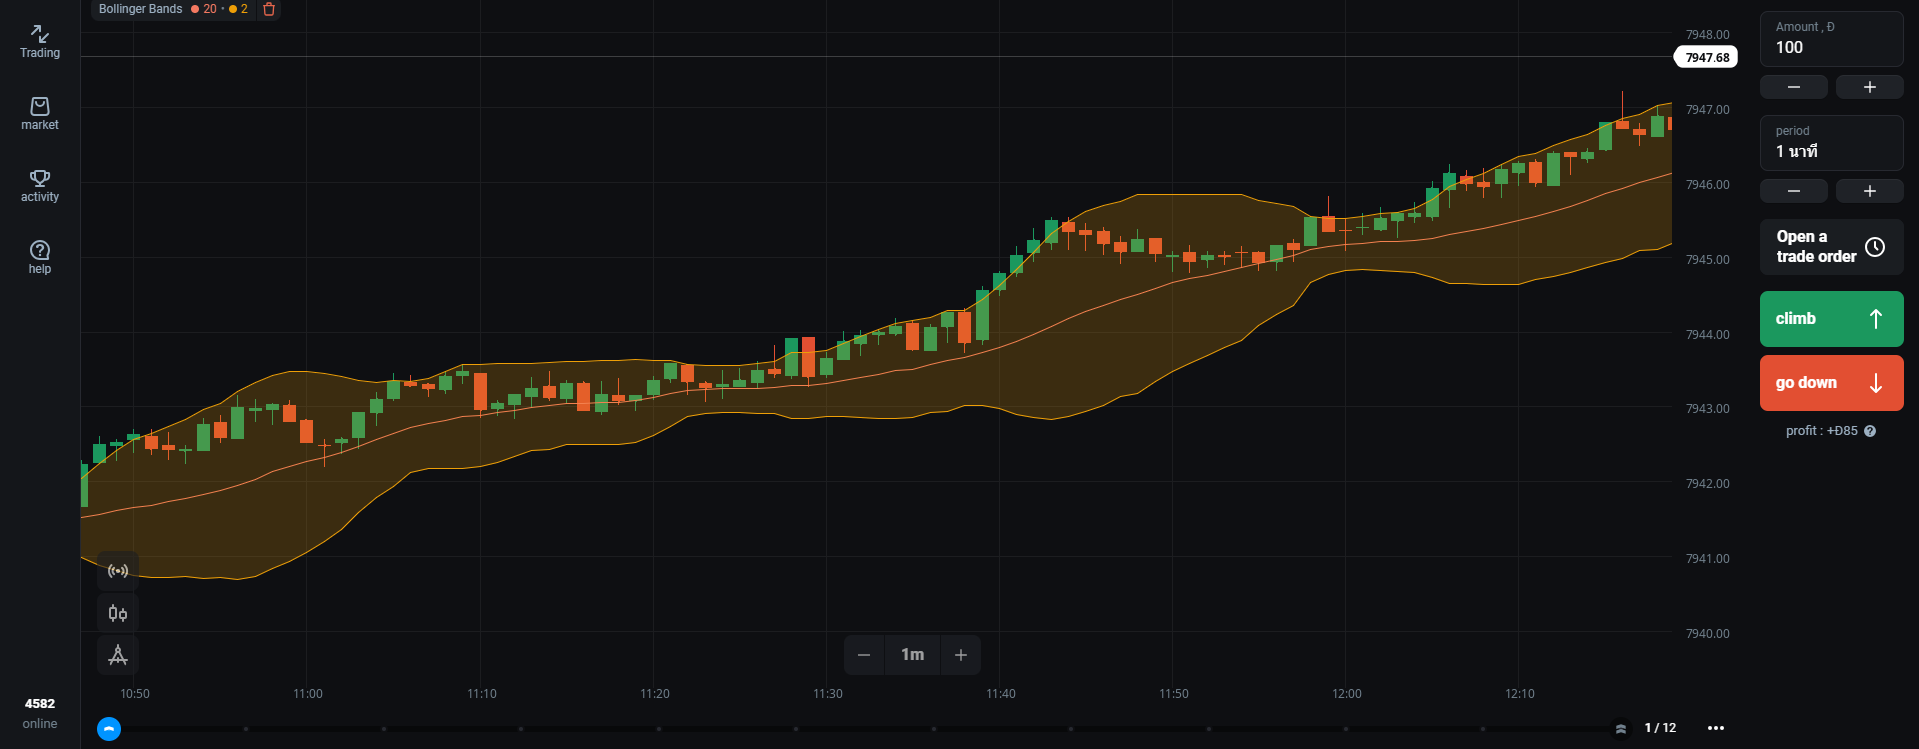
Bollinger Bands stands second in my list, The Bollinger Bands indicator was developed by John Bolliger. This indicator consists of three moving average lines which oscillate around the price. When the price touches the top moving average line it signals an upcoming bearish trend and vice versa when the price touches the bottom moving average line it signals an upcoming bullish trend. You can even use the middle band to identify the continuation of the trend or the reversals.
Key Features
- Bollinger Bands is a Momentum oscillator made from three moving average lines named as upper band, lower band and middle band.
- When the price touches the lower band it signals an upcoming bullish trend meanwhile when the price touches the upper band signals an upcoming bearish trend.
- You can even identify the strength of the trend with the expansion of the band it signals a strong bullish trend or bearish trend meanwhile the contraction represents a sideways or a narrow market.
Read: How to trade properly with Bollinger Band on Olymp Trade?
Read: Use Double Bollinger band to place high accuracy trades
1> Moving Average
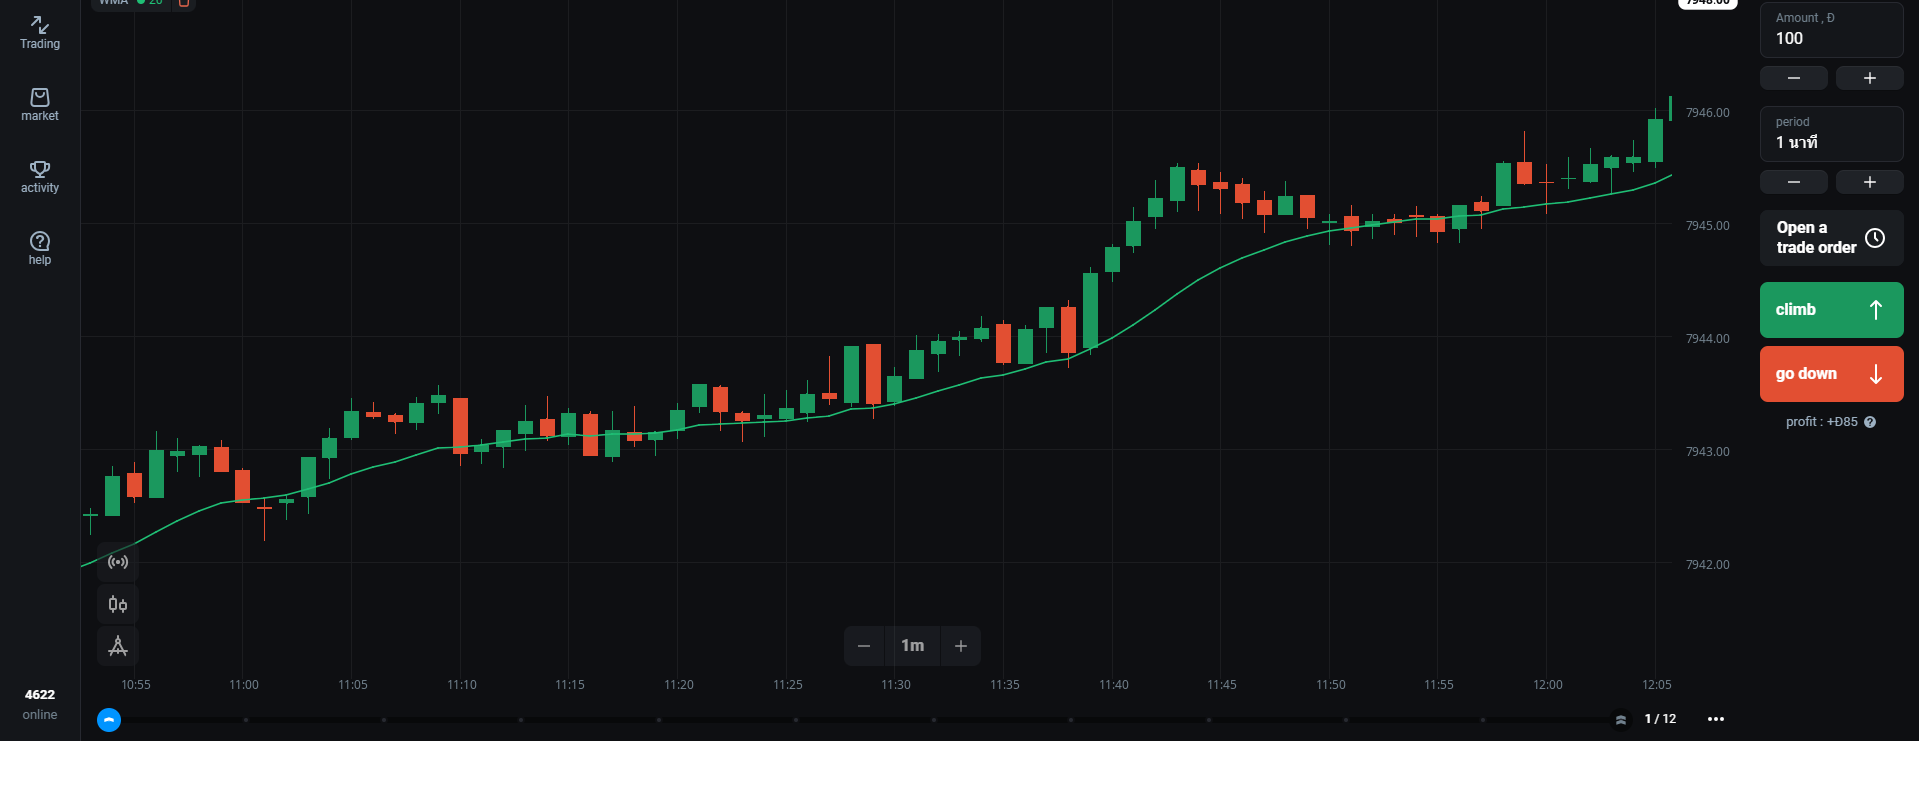
Moving Average is my favourite indicator and I use it a lot. This indicator comes in three major types Simple moving average, Exponential moving average and Weighted moving average. I personally love and use Weighted moving average a lot. Weighted moving average reacts much more faster to price changes and give highly accurate trading signals.
Key Features
1> The Moving average indicator is one of the most popular indicators that is even used in multiple popular indicators like the Relative Strength Index or Stochastic Oscillator.
2> The Moving average is the most powerful indicator that reacts much more faster to the price changes than any other moving average indicator.
3> You can adjust the indicator duration with the shorter duration used for short time frame charts and vice versa longer indicator duration is used for longer time frame charts.
Read: Get high quality signals from EMA indicator at Olymp Trade
Learn to trade with SMA Strategy at Olymp Trade
