Understanding Parabolic SAR
The parabolic SAR or you can call it parabolic stop and reverse developed by J. Welles Wilder Jr. is a trend following indicator that helps traders to predict an upcoming trends and reversals using a series of dots either above or below the price. when the dots are below the price it signals an upcoming bullish trend and traders might consider entering a buy position similarly, when the dots are above the price it signals an upcoming bearish trend and traders might consider entering a sell position. When the dots flips, it indicates a potential change in the price direction. For instance, if the dots are below the price and when they flip above the price it could signal a further change in price direction from bullish to bearish.
How to apply parabolic SAR on pocket option chart

First and foremost you need to login to your Pocket option chart. In case you don’t have one click here. Next, click on the indicator button at the top of the page and search for the parabolic SAR in the list. Next, click the indicator name and apply the necessary amendments based on your trading experience and nature. You can also change the colour of the Parabolic SAR dots and increase or decrease the indicator period.
How to find buy and sell signals using Parabolic SAR
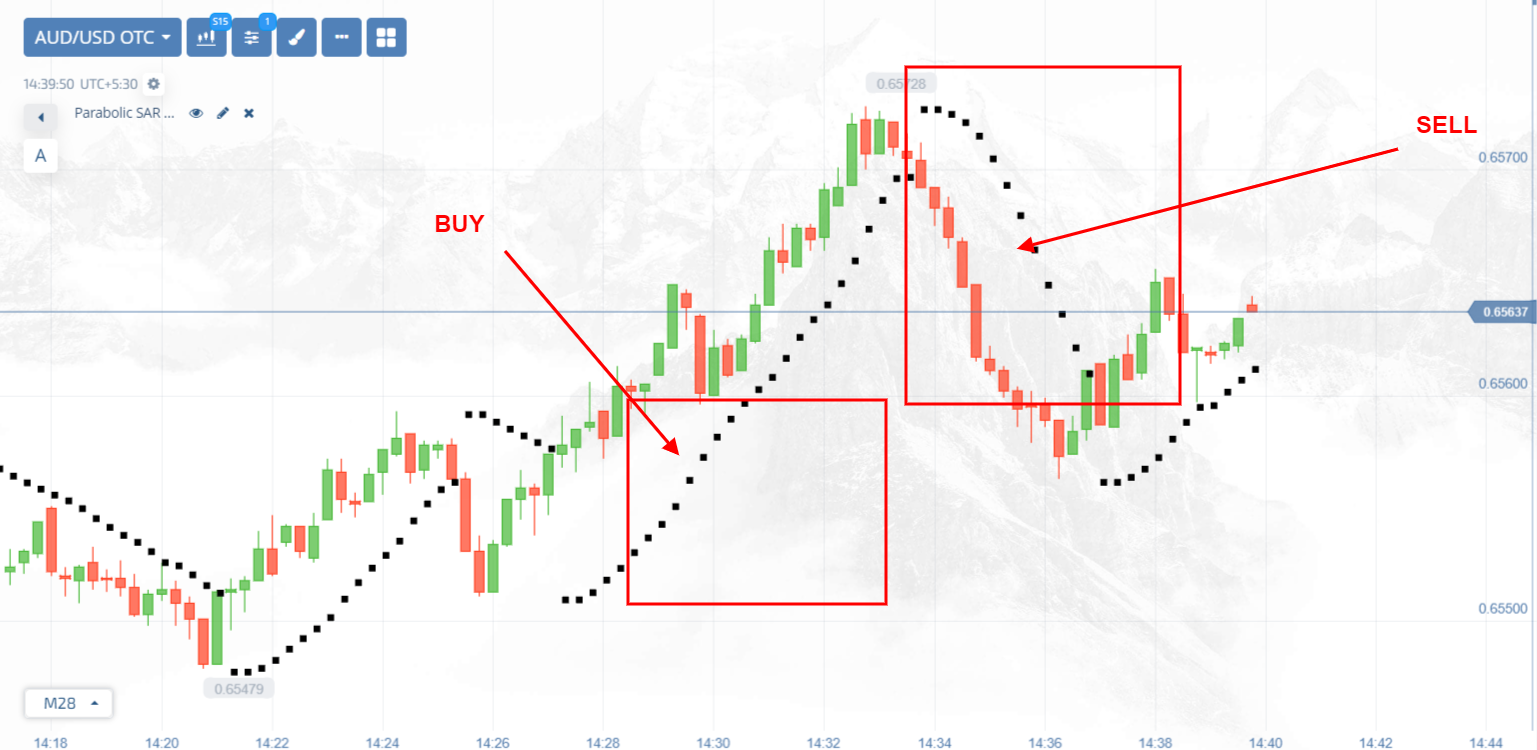
Parabolic SAR is a easy to use indicator you just need to focus on the indicator dots and place trades accordingly.
When you see the Parabolic SAR dots above the price it signals an upcoming bearish trend and vice versa, When you see the Parabolic SAR dots below the price it signals an upcoming bullish trend.

Indicators that complement to Parabolic SAR
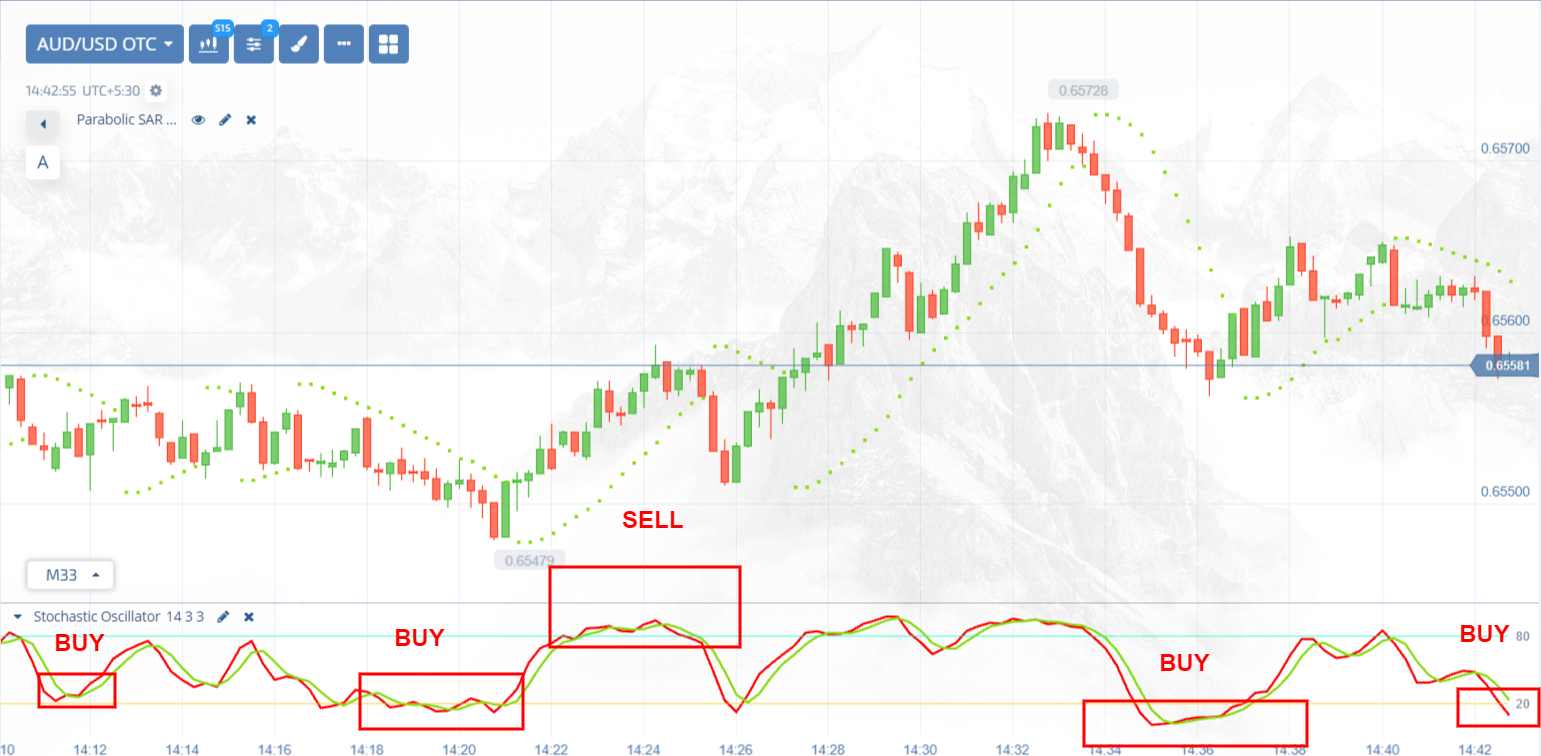
In trading it is always a good idea to combine multiple indicators that can help you confirm a certain signal then to solely rely on a specific indicator. Using a indicator combinator like RSI, Stochastic & Moving average can surely give you a very strong signals when combined with Parabolic SAR.
For Instance, When the Parabolic SAR dots are above the price plus the Stochastic Oscillator lines intersects below the oversold level it confirms a strong bullish trend and simialrly, When the Parabolic SAR dots are above the price plus the Stochastic Oscillator lines intersects above the overbought level it confirms a strong bearish trend.
How accurate is parabolic SAR
Parabolic SAR is one of the most powerful trading indicators. This indicator showed the result at a 95% confidence level in a study of 17 years of data. Given below is the list of factor that can impact the indicator’s performance.
Market Condition: This indicator is proven to perform better in trending markets, higher the performance of this indicator may be affected during the choppy markets the price movements are less predictable and may result in more false signals.
Settings and time frame: Settings and time frame also play a very crucial role in providing a high quality signals. For instance, you are an aggressive trader who loves to trade on short time frame chart you are using a default period in the indicator may impact the results.
Conjunction with other indicator: The parabolic SAR is often used in conjunction with other technical analysis tools and indicators to confirm the signal strength and improve the accuracy. for instance combining it with other trend indicators like Stochastic, MACD can also impact the results.
