There are multiple candlestick patterns that will help you find the upcoming trend reversals and the Doji candlestick pattern is one of them. The Doji pattern is one of the most powerful candlestick patterns I have ever seen. and In this article, I will show you how you can use this pattern to find quality signals in Olymp Trade.
What is Doji Candlestick Pattern?
Doji Candlestick Pattern is a trend reversal pattern that mostly appears after hours of a bullish or bearish trend. You can easily identify this pattern with a long shadow and a big body. The opening and the closing of this pattern are the same. This pattern displays an intense struggle between the buyers and the sellers. Here, both the parties are optimistic and they try their level to bring the price up or down. The appearance of the pattern signals an upcoming trend reversal. When you see a Doji candlestick pattern after an hour of a bullish trend it suggests an upcoming bearish trend and vice versa, When you see a Doji candlestick pattern after an hour of a bearish trend it suggests an upcoming bullish trend.
How does Doji Candlestick Pattern work?
As, I said above Doji Candlestick Pattern is a trend-reversal pattern and can help you find the upcoming trend and reversals.
For Example, A Doji candlestick pattern that forms during an uptrend signifies bullish exhaustion and the entry of optimistic sellers and vice versa, and A Doji candlestick pattern that forms after a downtrend signifies bearish exhaustion and the entry of optimistic buyers.
However, You should not take this pattern for granted as the appearance of this pattern does not necessarily means a trend reversal. Instead, It shows confusion or a struggle between the buyers and sellers. Hence, You should always consider using trend indicators like RSI, or Parabolic SAR to confirm the trend reversal. If both the parameters approve the same. It signals a very strong trend.
Types of Doji Candlestick Patterns in Olymp Trade
In the majority, there are three types of Doji candlestick Patterns in Olymp Trade. However, The function of all three patterns is the same they signal a trend reversal.

1. Classic Doji Pattern
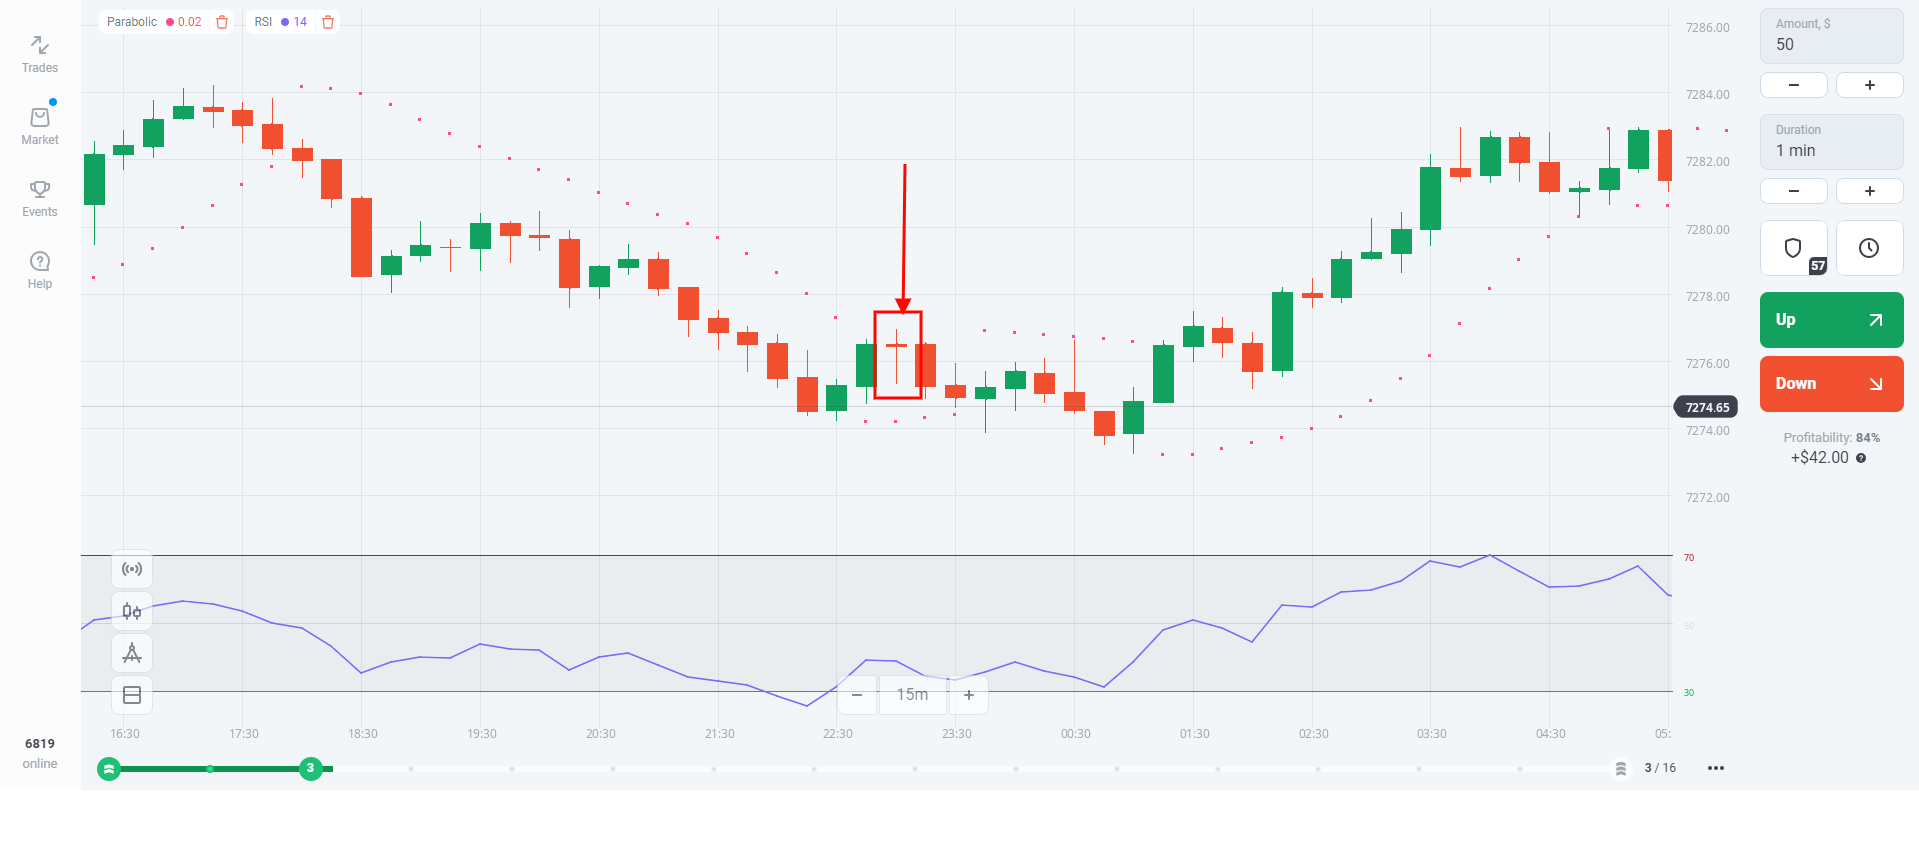
Given above is the 15-minute chart of the Europe Composite Index, and we can clearly see an example of a Classic Doji Pattern. As, you can clearly see the red doji pattern after a bearish trend plus the RSI line is near the oversold level. However, you should a place a buy trade when you see two or three green candles.
2. Dragonfly Doji

Dragonfly Doji displays a T-shaped candlestick with an opening and closing at the top. This pattern has a long bottom wick but almost zero upper wick. As you can above, both the candlestick pattern and RSI line signal a bearish trend so, you can place a sell trade.
3. Graveyard Doji
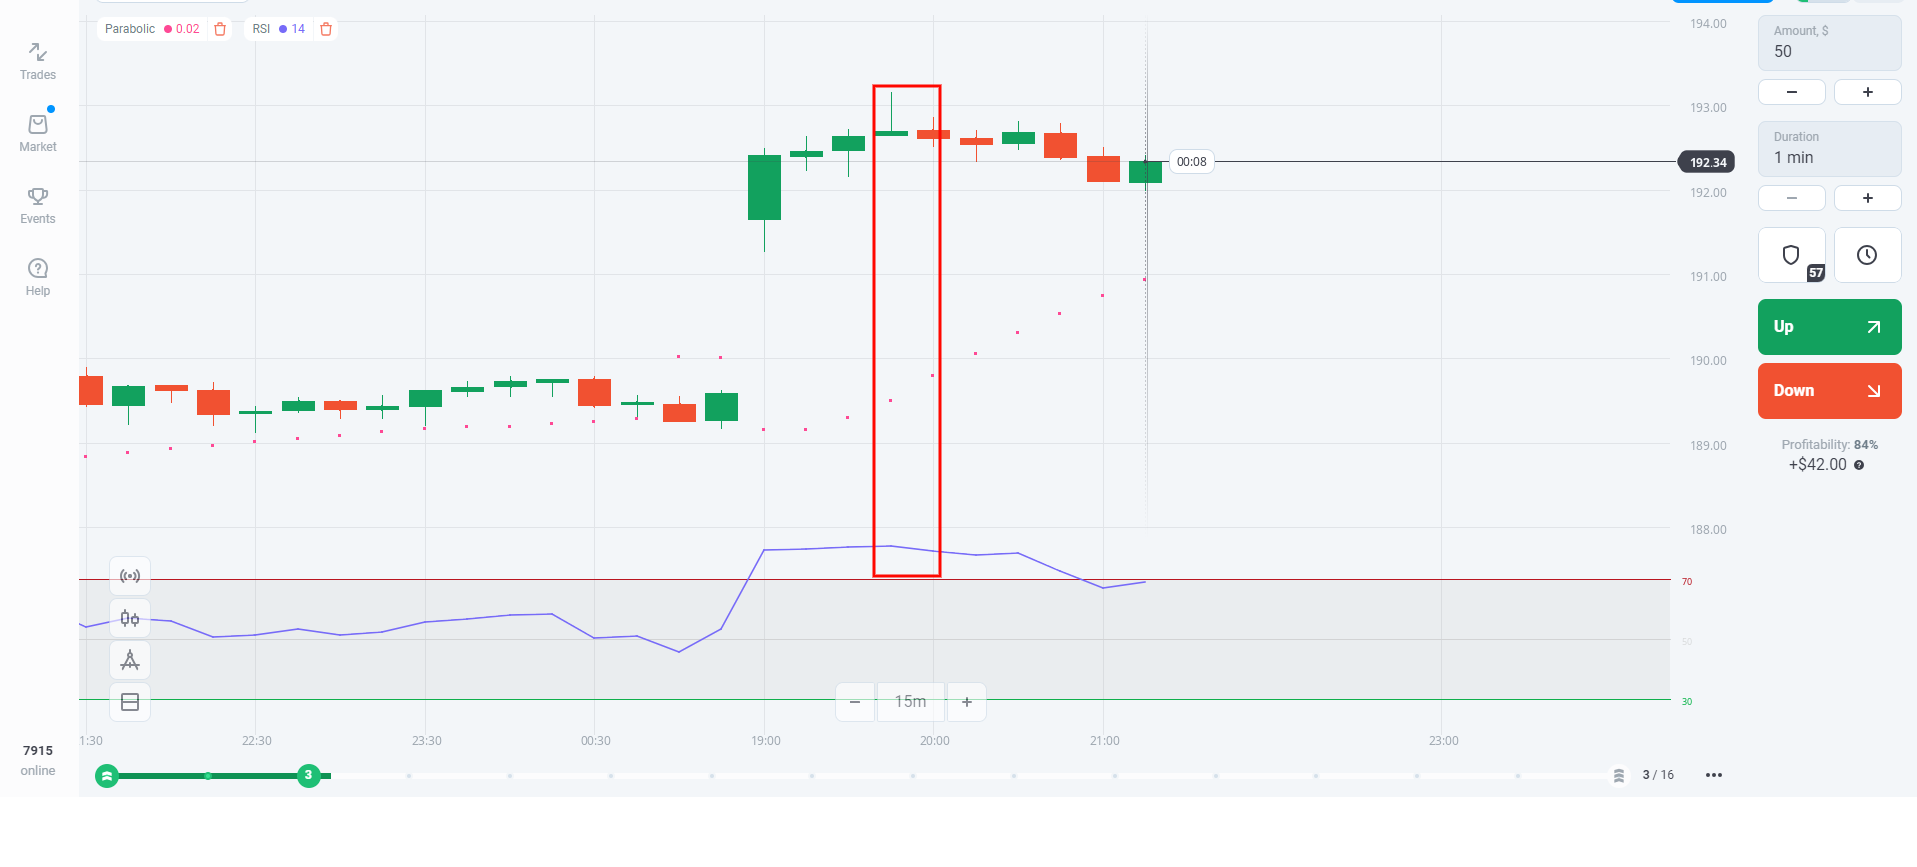
Graveyard Doji is an inverted T-shaped Doji pattern where both the opening and closing are at the bottom. Given above, is a 15-minute chart of Apple and we clearly the Graveyard Doji pattern near the overbought level in RSI so, so here we can place a sell trade for 20 minutes.
Try Doji Pattern in Olymp Trade for Free: Visit the Olymp Trade Official site
