Signing up is free and takes 5 secs only…
What is the Accelerator Oscillator Indicator?
The Accelerator Oscillator or you call it Bill Williams accelerator oscillator is one of the most popular trend indicators that is used to measure the acceleration or the deceleration of the security’s price. The Bill Williams accelerator oscillator is a trend indicator that was developed by one of the most popular technical analysts Bill Williams. The main purpose behind introducing this indicator was to help traders all around globe to identify the price movement of a security using a series of histogram bars.
Components of Accelerator Oscillator

Awesome oscillator: The Awesome oscillator calculates the difference between a 34-period and 5-period simple moving averages (SMA).
Histogram: Histogram is the most important component of the Accelerator Oscillator. With the bars plotted above or below the zero line the length and the direction of the bar indicate the strength and the direction of the security’s price momentum.
Zero line: Zero line is another one of the most important components of the indicator. The histogram bar oscillates either or below the zero line via which you can identify the upcoming trends and reversals.
How to use Accelerator Oscillator on Pocket Option

The Accelerator Oscillator is a free-to-use tool and you can even use this indicator on the Pocket Option demo account. To apply the Accelerator oscillator on the Pocket Option chart follow the steps given below
1> Login to your Pocket Option account: Get access to a Pocket Option account. In case you don’t have one click here.
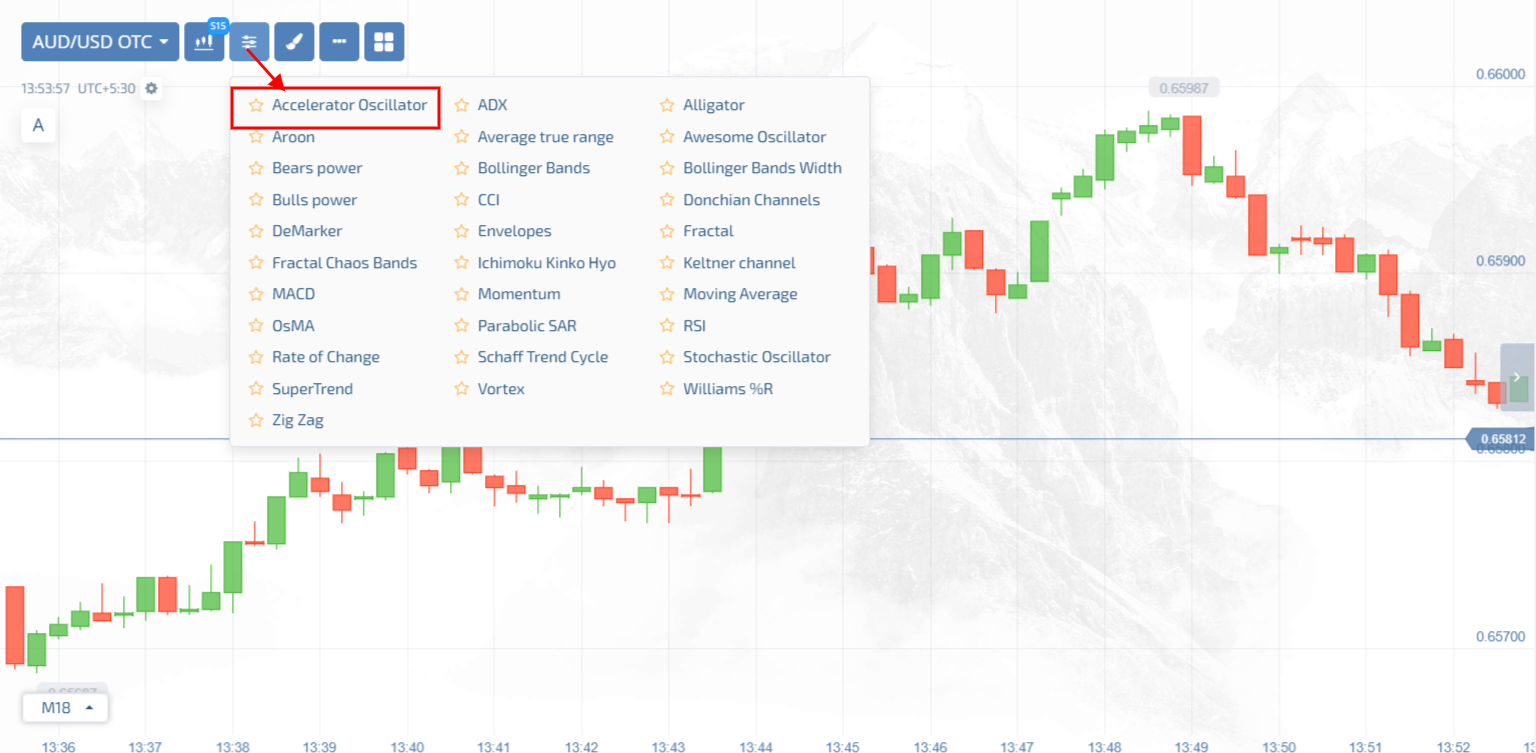
2> Select the indicators menu: Once you have logged in click on the indicator menu at the top of the page and search for the accelerator oscillator in the list.
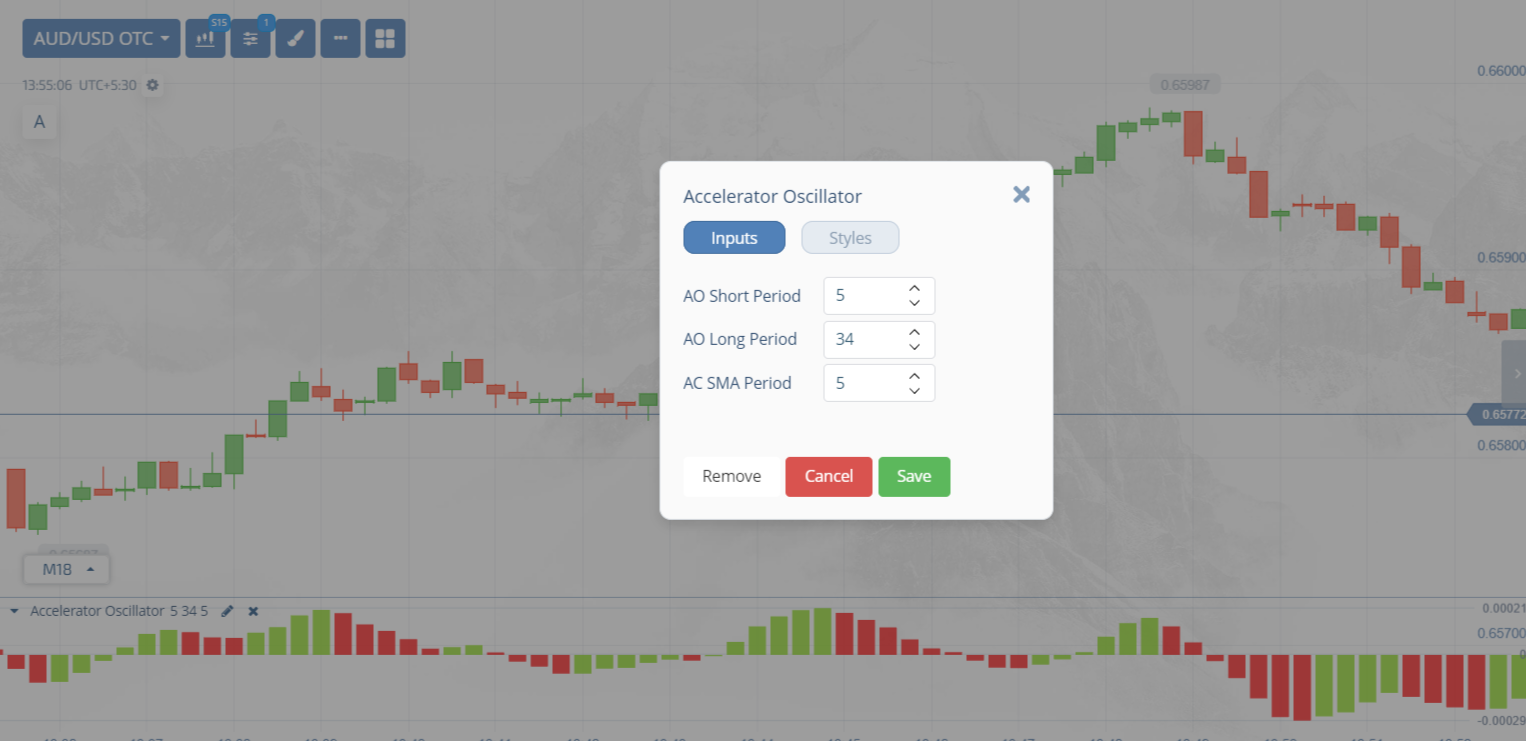
3> Make necessary amendments: Lastly, make necessary amendments based on your trading experience and nature.
How to use the Accelerator Oscillator on the Pocket Option

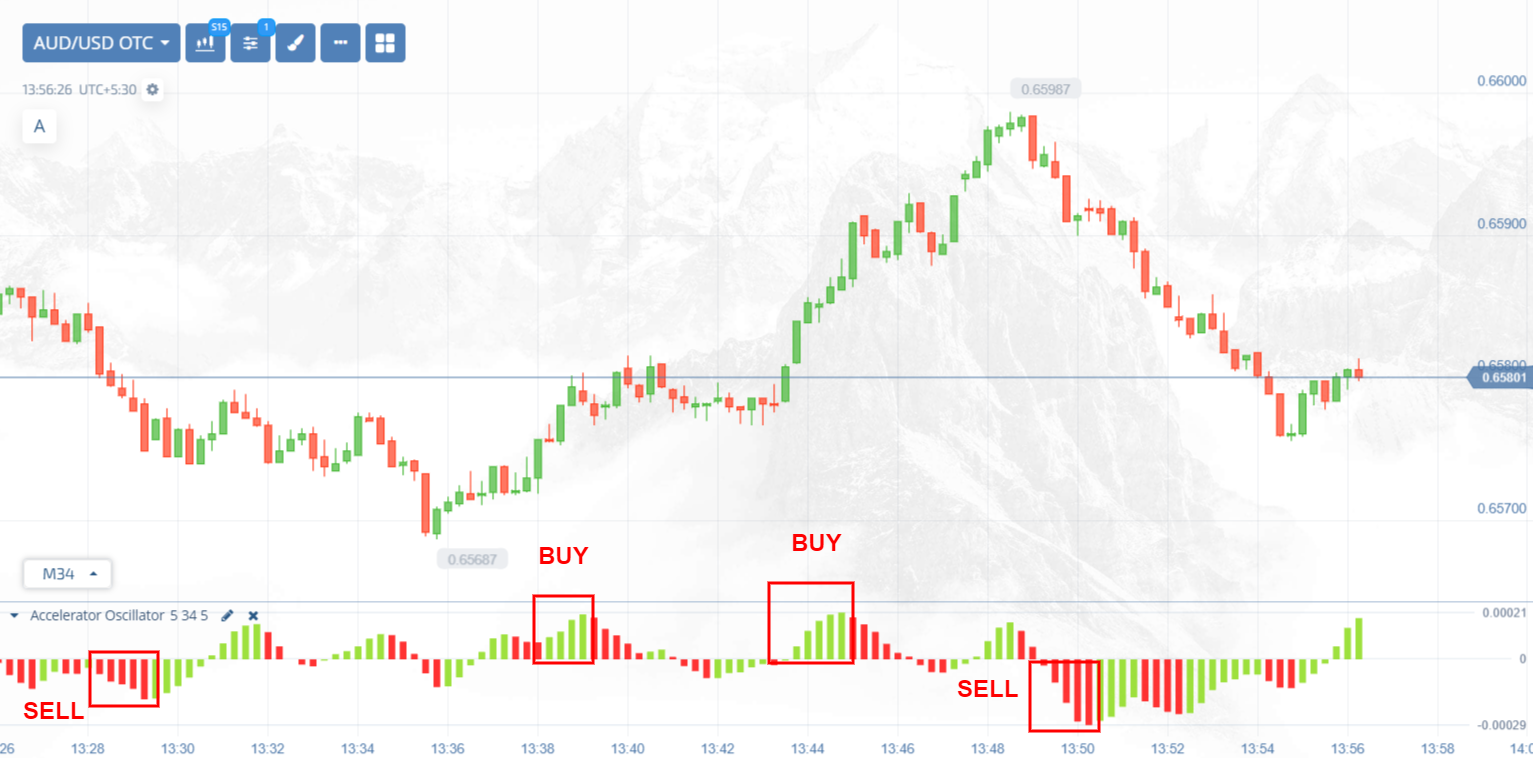
> Solo: You can use a solo accelerator oscillator on the Pocket option chart. You just need to focus on the histogram bars with the green bars above the zero line indicates a bullish trend and you can use this opportunity to place a buy trade.

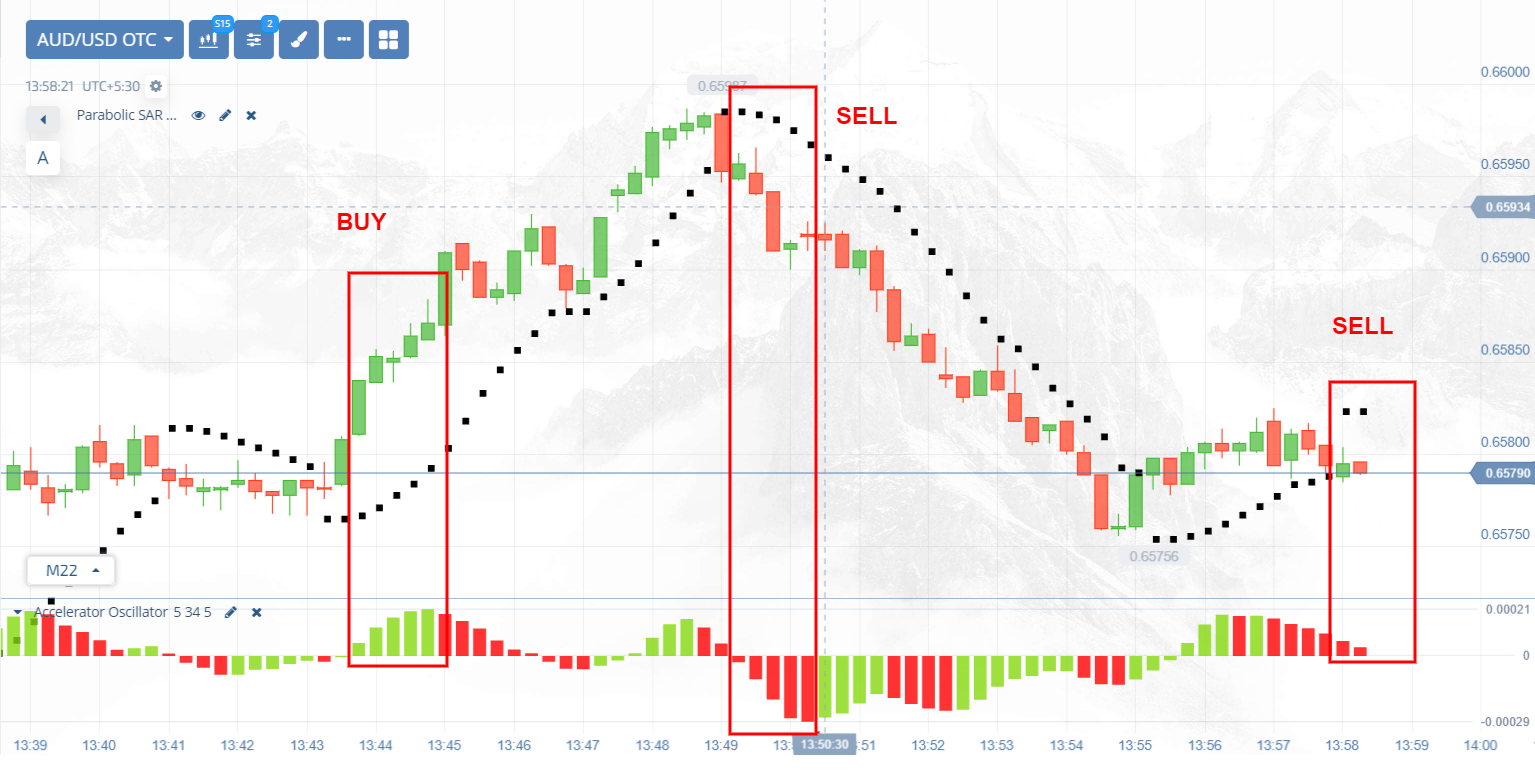
> Dual indicator: You can even use a dual indicator on the Pocket option chart. Just click on the indicator button and apply your desired indicator that you can simply use with the Accelerator oscillator for instance let’s combine the Accelerator oscillator with Parabolic sar. When you see a bearish trend in the accelerator oscillator plus Parabolic SAR dots are above the price it signals a bearish trend similarly, when you see a bullish trend in accelerator oscillator plus Parabolic SAR dots is below the price it signals a bullish trend.


