Binomo Triple RSI Strategy: How to Use RSI 7, 14 and 21
Last updated: September 2026
If you’re searching for a simple way to analyse short-term price movements on Binomo, the Triple RSI strategy is one setup you can test.
This strategy uses three Relative Strength Index (RSI) indicators with different periods: 7, 14 and 21. The idea is to compare short-, medium- and longer-period momentum instead of relying on a single RSI reading.
However, there is an important point to understand before using any trading strategy: no indicator can guarantee profitable trades. RSI can remain above 70 or below 30 for an extended period, particularly when a market is trending strongly.
In this guide, I’ll explain how I use the Triple RSI setup, how to configure it, what I look for before considering a trade, and how I manage risk.
Risk warning: Trading involves a substantial risk of losing money. This article is for educational and informational purposes only and should not be considered financial advice. Never trade with money you cannot afford to lose.
Why I Use the Triple RSI Setup
I’m Subham Sahuwala, and I have been studying and trading financial markets for several years, including using platforms such as Binomo and Olymp Trade.
My experience with these platforms has taught me one important lesson: having an indicator is not enough. A trading setup needs clear rules, disciplined risk management and realistic expectations.
I also recommend keeping records of your trades so that you can evaluate whether a strategy actually works for your trading style and market conditions.
If you see screenshots or trading results on this page, remember that past results are not a guarantee of future performance.
What Is RSI?
RSI stands for Relative Strength Index. It is a momentum oscillator developed by J. Welles Wilder and measures momentum on a scale from 0 to 100.
Traditionally:
- RSI above 70 is considered an overbought condition.
- RSI below 30 is considered an oversold condition.
- RSI around 50 can be useful when assessing momentum and trend context.
These levels should not be interpreted as automatic buy or sell signals. A market can remain overbought while continuing to rise or oversold while continuing to fall.
What Is the Triple RSI Strategy?
The Triple RSI strategy uses three RSI indicators simultaneously:
- RSI 7 – reacts more quickly to recent price movements.
- RSI 14 – the commonly used standard RSI period.
- RSI 21 – reacts more slowly and can provide additional momentum context.
Using three periods allows you to compare different levels of momentum.
The basic idea is to look for situations where all three RSI indicators are showing similar momentum conditions.
How to Set Up Triple RSI on Binomo
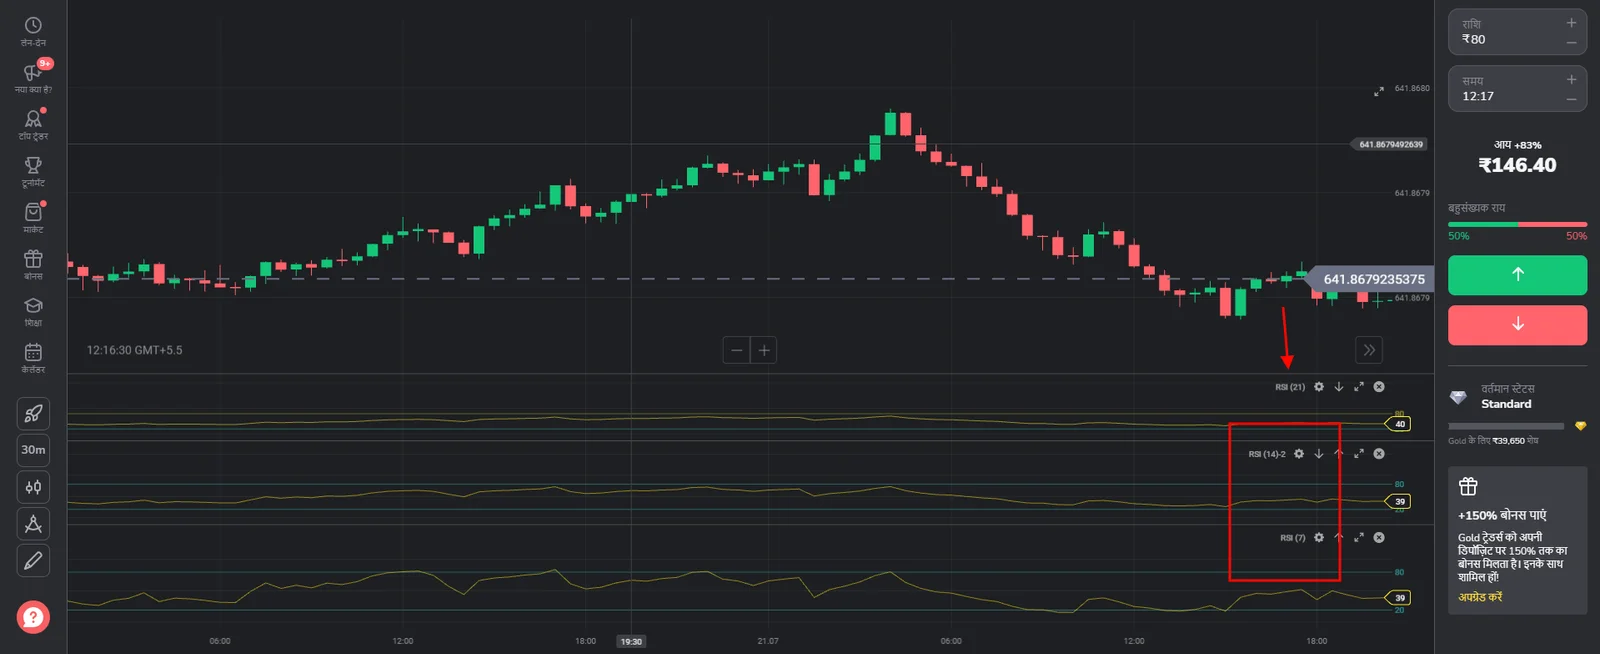
Before using the strategy with real money, I recommend testing it on a Binomo demo account.
Step 1: Open the chart
Log in to your Binomo account and open the trading chart.
Choose Candlestick as your chart type if you prefer to analyze price action using candlestick patterns.
Step 2: Add the RSI indicator
Open the indicator menu and select RSI (Relative Strength Index).
Add the RSI indicator three times to the chart.
Step 3: Change the RSI periods
Set the three RSI indicators to:
RSI 7
RSI 14
RSI 21
You can use different display settings for each RSI so that you can distinguish them easily.
The 14-period RSI is the traditional setting, while shorter periods generally make RSI more sensitive to recent price movements.
How I Read the Triple RSI Setup
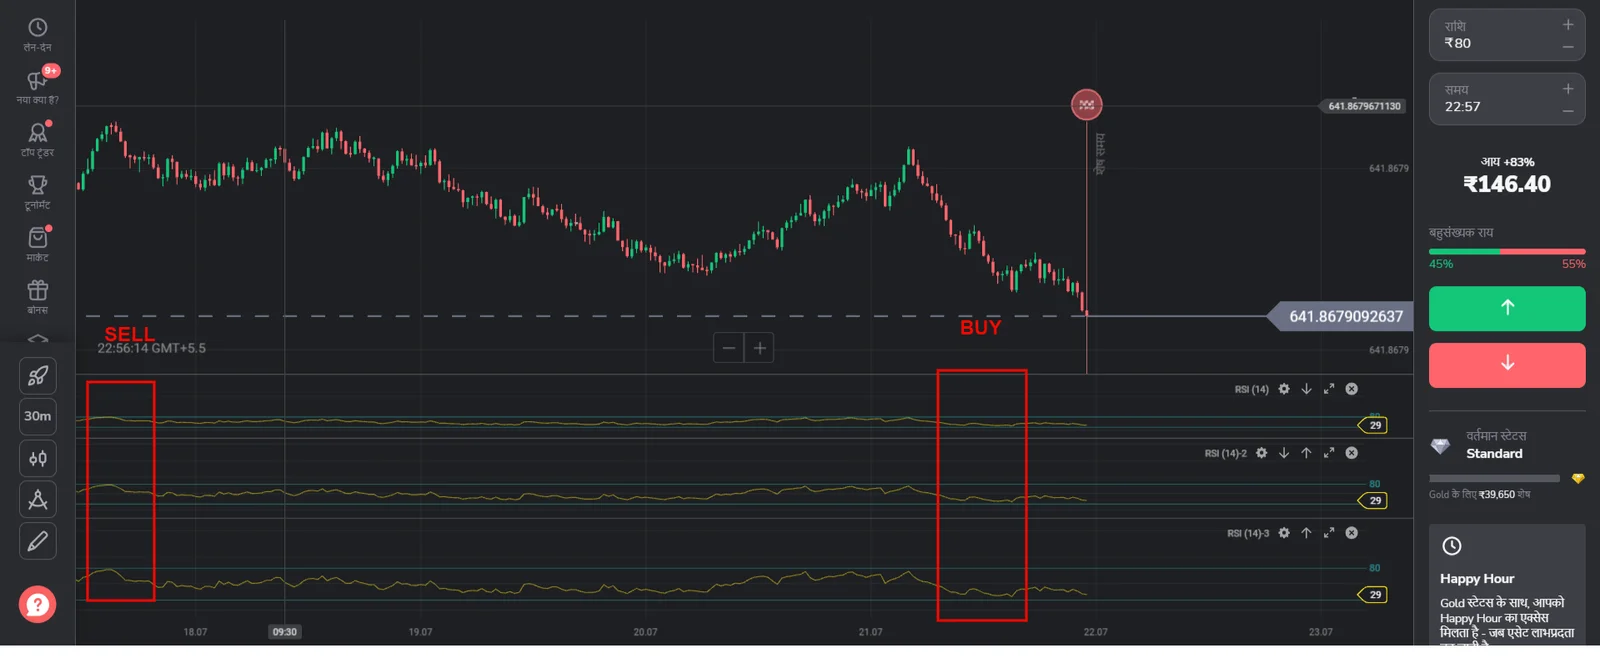
The strategy should not be treated as a simple rule where:
RSI below 30 = Buy
or
RSI above 70 = Sell.
Instead, I use the three RSI readings as a way of identifying potential momentum extremes and then look at price action for additional confirmation.
Potential bullish setup
A potential bullish setup occurs when:
- RSI 7 moves into or below the oversold area.
- RSI 14 also approaches the oversold area.
- RSI 21 confirms similar weakness.
- Price begins showing signs of recovery.
- A bullish candlestick or other price-action confirmation appears.
Instead of entering immediately when RSI reaches 30, I prefer to wait for evidence that momentum is beginning to change.
For example, you might wait for RSI to move back above the oversold area together with a bullish price-action signal.
Potential bearish setup
A potential bearish setup is the opposite.
You can watch for:
- RSI 7 moving into or above the overbought area.
- RSI 14 showing similar strength.
- RSI 21 confirming the broader momentum condition.
- Price beginning to lose upward momentum.
- A bearish candlestick or other price-action confirmation.
Again, an RSI reading above 70 does not automatically mean that price will fall.
Example of a Triple RSI Signal
Suppose all three RSI indicators move toward the oversold area.
At this point, I would not automatically enter a trade.
Instead, I would wait to see what happens next.
For example:
- RSI 7 begins moving upward.
- RSI 14 starts recovering.
- RSI 21 confirms that momentum is no longer deteriorating.
- Price forms a bullish candlestick pattern.
This combination can provide more context than looking at one RSI reading alone.
The same principle can be applied to potential bearish setups.
Why RSI Confirmation Matters
One of the biggest mistakes beginners make is treating an indicator as a prediction tool.
RSI does not know what price will do next.
An RSI reading tells you something about recent momentum. It does not guarantee that the next candle will move in a particular direction.
For that reason, I recommend combining RSI with:

- Price action
- Candlestick patterns
- Market trend
- Support and resistance
- A predefined risk-management plan
This can help you avoid taking every RSI 30 or RSI 70 reading as a trade signal.
My Money Management Rule
A trading strategy is only one part of a trading plan.
Risk management is equally important.
In the past, I have used a rule of limiting the amount exposed on an individual trade to a small percentage of the available trading capital.
If you choose to use a percentage-based rule, decide your maximum risk before entering the trade and stick to it.
For example, if your predetermined risk limit is 1% of your trading capital, a ₹10,000 account would have a maximum planned exposure of ₹100.
The exact percentage should depend on your own financial circumstances and risk tolerance.
I also strongly recommend avoiding aggressive recovery systems such as increasing the next trade simply because the previous trade lost.
Practice the Strategy on a Demo Account
If you are new to trading, don’t start by depositing a large amount of money.
Instead:
- Open a demo account where available.
- Configure RSI 7, 14 and 21.
- Record every setup.
- Write down why you entered.
- Record the outcome.
- Review your results after a meaningful sample of trades.
A trading journal can help you identify whether the strategy is actually working for you instead of relying on a few successful screenshots.
Can You Get Rich Trading on Binomo?
There is no reliable shortcut to becoming rich through trading.
Trading can result in both profits and losses, and there is always a possibility of losing your trading capital.
I would therefore avoid treating Binomo or any other trading platform as a guaranteed income source.
A better approach is to focus on:
- Learning market fundamentals
- Developing a repeatable process
- Practicing before risking real money
- Managing risk
- Keeping accurate trading records
- Understanding the product and platform you’re using
How to Deposit on Binomo
If you decide to use Binomo, check the platform’s current deposit page for the payment methods and minimum amount available in your country.
The available payment methods and minimum deposit requirements can change depending on your location and payment provider.
Do not rely on old screenshots or outdated articles for current deposit information.
Frequently Asked Questions
What is the Triple RSI strategy?
Triple RSI is a technical-analysis setup that uses three RSI indicators with different periods. In this guide, the periods are 7, 14 and 21.
The purpose is to compare short-, medium- and longer-period momentum.
What are the best RSI settings for Binomo?
There is no universally “best” RSI setting.
The traditional RSI setting is 14 periods, while shorter periods can make the indicator more responsive to recent price movements.
For this particular setup, I use 7, 14 and 21, but traders should test settings themselves rather than assuming that one combination will always work.
Does RSI 30 mean I should buy?
No.
An RSI reading below 30 traditionally indicates an oversold condition, but it does not guarantee that price will rise.
Price can continue falling while RSI remains oversold.
Does RSI 70 mean I should sell?
No.
An RSI reading above 70 traditionally indicates an overbought condition, but price can continue rising during a strong trend.
Use RSI as part of a broader analysis rather than as an automatic entry signal.
Is Triple RSI a guaranteed strategy?
No.
Triple RSI cannot guarantee profitable trades, and there is no trading indicator that can accurately predict every future price movement.
The strategy should be tested on historical and demo data before considering real-money use.
Can beginners use the Triple RSI strategy?
Beginners can learn the concept, but I recommend starting with a demo account and learning basic technical analysis and risk management first.
Do not risk money simply because a strategy appears successful in a few examples.
Is Binomo safe to use?
Before using any trading platform, check its current terms, applicable restrictions in your country, fees, withdrawal conditions and risk disclosures.
Binomo’s own client agreement states that trading involves significant risk and that it does not guarantee profits or the absence of losses.
You should also confirm whether the service is legally available to you in your country before depositing funds.
Final Thoughts
The Triple RSI strategy is a relatively simple technical-analysis setup based on RSI 7, RSI 14 and RSI 21.
I use it as a way to compare momentum across different periods rather than treating it as a prediction tool.
The most important lesson is that no strategy wins every trade.
If you want to test Triple RSI, start with a demo account, keep a trading journal, use strict risk management and evaluate the strategy over a meaningful number of trades.
Don’t trade because you expect a “hack” to make you rich. Focus on developing a repeatable process and understanding the risks involved.
Affiliate Disclosure
Some links on this page may be affiliate links. If you use one of these links to sign up or make a purchase, I may receive a commission at no additional cost to you. This does not change the information or risk involved with the service.
Risk Disclosure
Trading financial products involves significant risk and may result in the loss of your capital. Past performance, screenshots, examples and personal trading results do not guarantee future results. Always consider your financial situation and applicable laws and regulations before trading.
